
I recently had the following functionality request: Can we click on the North America Region to focus all other charts on the dashboard to North America and drill down into sub-groups in North America? Essentially, filter to one category and then see it at a more granular level of detail in Tableau.
Given this request, I wanted to share how to implement this interactivity in Tableau using parameter actions and the Superstore dataset with two examples:
- Drill down & Filter: Click on a data point, filter to that selection, and show the next layer
- Expand: For a selected data point, show the next level of detail
Before we start, there are numerous blogs and how-to guides utilizing Sets to accomplish the same outcome. So why use parameters?
The parameter & action setup is straightforward, while sets can get complex quickly. From a performance standpoint, set & parameter actions are comparable.
Tip: Before any design or build-out, make sure to conduct your user interviews. That will inform what to build and what types of interactions will be most useful. Note: One limitation of this method is that you are unable to multiselect.
How to Create a Drill-Down and Filter Using Parameter Actions
Use parameter actions to drill down from high to low levels in a hierarchy and filter for your selections. The below gif begins by drilling into the Technology category. By clicking technology, we filter to Technology data and then show only technology sub-categories.
1. Create a parameter for every field you want to drill into, configure it as a string, list and populate with all possible values of your field, and add one more option called “All.
- I plan to start my analysis at the category level before drilling down to the sub-category level to drill down to the manufacturing level. So I created two parameters: Category and Sub-Category.
- Remember that you must update the parameter list if your field changes. If “Apparel” is added to Superstore categories, you must add “Apparel” to your parameter.
2. Create a field to use as your category axis.
Tip: I like to use a standard naming convention, such as “param. [Field Name],” to keep the workbook clean
The calculated field works as follows:
- If both Category & Sub-Category are set to “All” show the Category Field. This is the highest level that I’ll want to see.
- When the Category Parameter is set to a single option, like technology, then we’ll want this field to show all Technology Sub-Categories.
- When the Category Parameter is set to a single option, like technology, and the Sub-Category Parameter is set to a single option, like “Copiers,” then we’ll want this field to show all Technology/Copiers Manufacturers.
IF [Parameters].[Category]="All" AND [Parameters].[Sub-Category]="All"
THEN [Category]
//top layer
ELSEIF [Category]=[Parameters].[Category] AND [Parameters].[Sub-Category]="All"
THEN [Sub-Category]
//middle drillable layer
ELSEIF [Category]=[Parameters].[Category] AND [Sub-Category]=[Parameters].[Sub-Category]
THEN [Manufacturer]
//lowest drillable layer
ELSE "Hide"
END
3. Add the param-calculated field to your view (rows or columns).
4. Add the param-calculated field to your filters pane, and exclude “Hide.”
- Hide won’t be an available option if the parameter is set to All, so you’ll have to do this using a custom value, as illustrated below.
- When a selection is made on your parameters, only that selection will populate, and all other values will be labeled as “Hide” and subsequently filtered out of the view.
5. Add your worksheet to a dashboard
6. Open Dashboard Actions (CTRL + SHIFT + D)
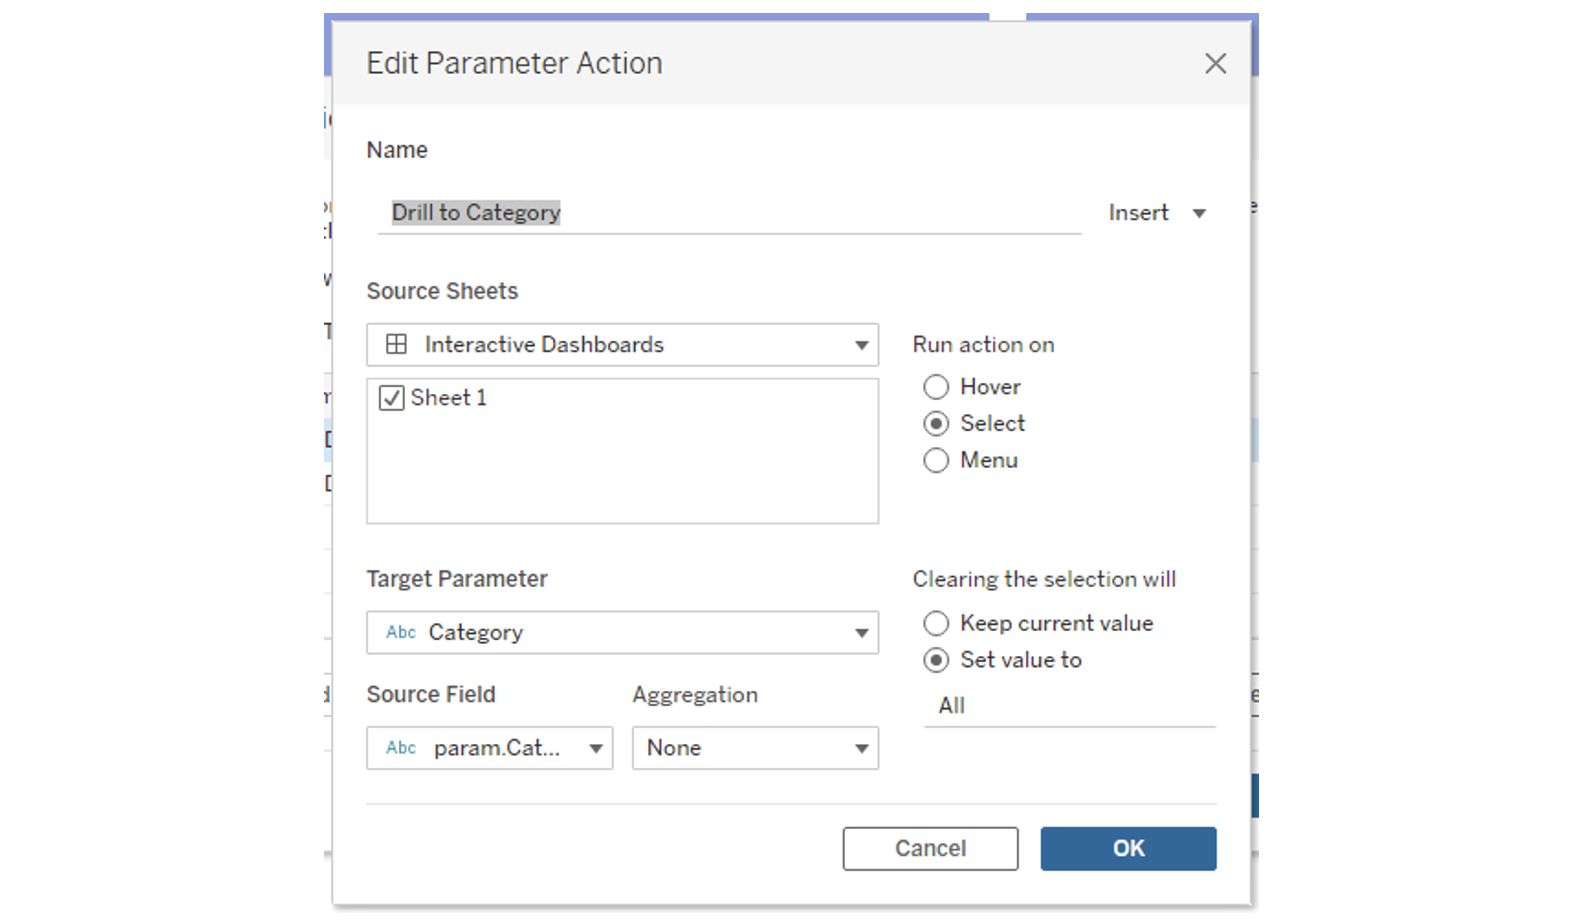
7. Add a parameter action and configure it as follows. This example outlines that you will need one action per parameter for multiple drill-downs. Each action will be configured the same way.
- Set the name
- Select the sheet you just created to drive the parameter action
- Run action on select
- Target Parameter = Category (or the top layer)
- Source Field = param.Category (or whatever field you created in step 2)
- Aggregation = None
- Clearing the selection will = Set the value to All
- This is important! This resets the parameters.
Now you’re good to go!
How to Expand the Details for a Selected Category Using Parameter Actions
Use parameter actions in Tableau to expand a single selection to the next level of detail. The below gif illustrates how a user would click a category to expose the underlying sub-categories.
Some other use cases could be:
- Expand business to see cohort groups
- Expand region to show salespeople
- Expand year to show months or quarters
- The sky is the limit!
The steps to set this up are very similar:
1. Create a parameter for every field you want to drill into, configure it as a string, list, populate it with all possible values of your field, and add one more option called “All.”
- I want to drill into Category to expand Sub-Category; therefore, I created one parameter: Category.
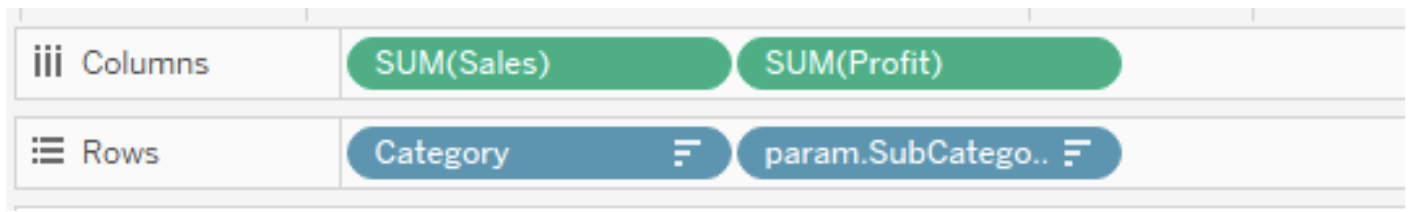
2. Create a field to use as your category axis
- I like to use the naming convention param.[Field Name] to keep the workbook clean
- The “All” option we added to all parameters acts as a “reset.”
- The field works as follows:
- If a selection is made in your category parameter, show the Sub-Category; for all other values, leave blank.
IF [Parameters].[Category]="All"
THEN ""
ELSEIF [Category]=[Parameters].[Category]
THEN [Sub-Category]
ELSE ""
END
3. Add your Top Level (not a calculated field) to the view & your calculated field from Step 2
4. OPTIONAL: Add this field to your filters pane, and exclude “Hide.”
- Hide won’t be an available option if the parameter is set to All, so you’ll have to do this using a custom value, as illustrated below.
- Do not add to the view if you don’t want to filter down to your selection. The example GIF above does NOT have the field on the filters.
5. Add your worksheet to a dashboard and open Dashboard Actions (CTRL + SHIFT + D)
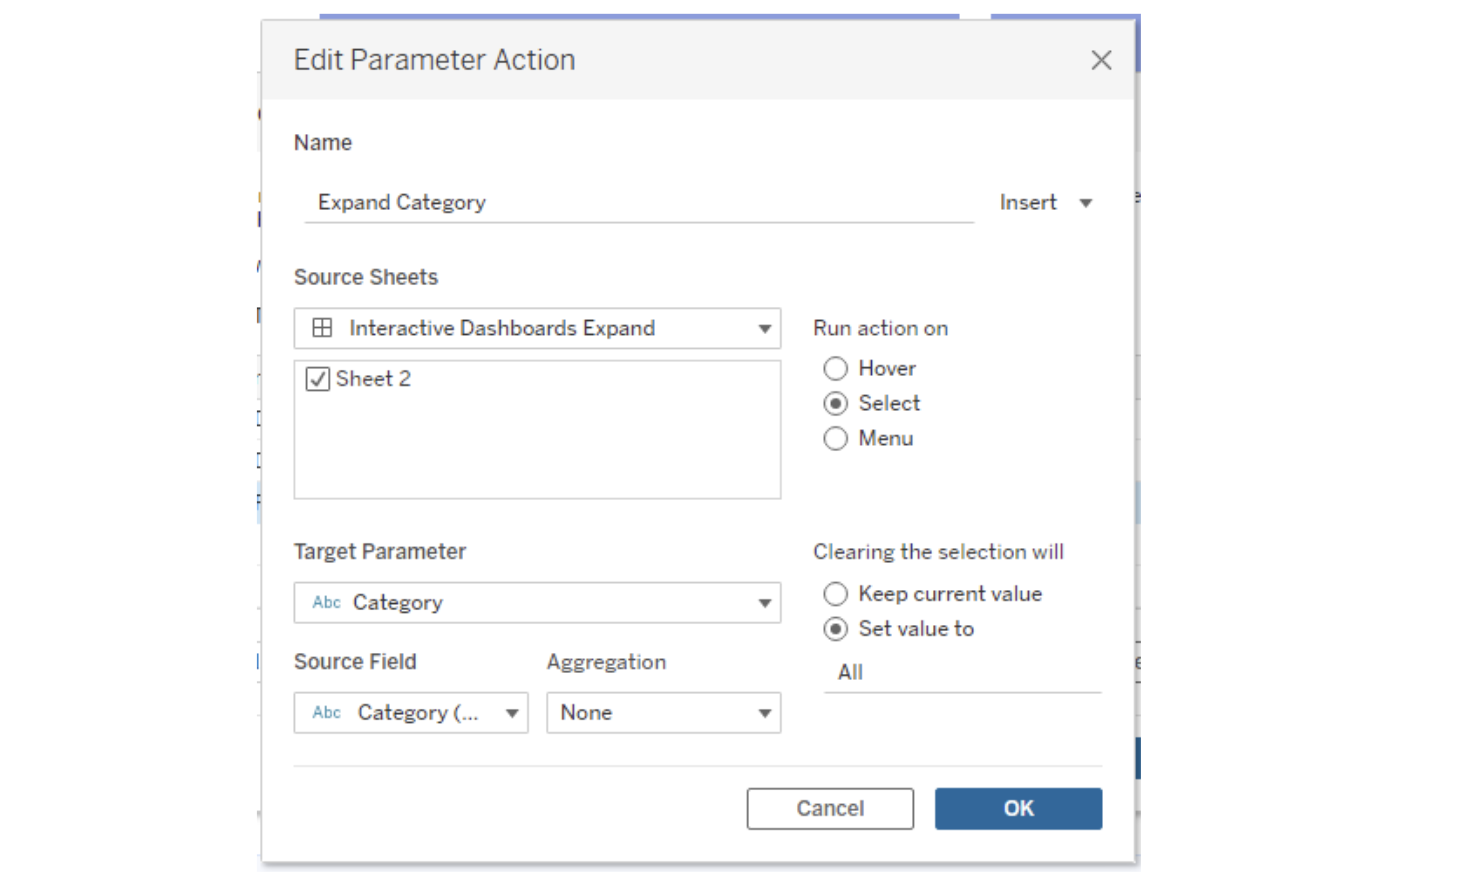
6. Add a parameter action and configure it as follows:
- Set the name
- Select the sheet you just created to drive the parameter action.
- Run action on Select.
- Target Parameter = Category (or the top layer)
- Source Field = Category (or whatever field you have on your worksheet that drills)
- Aggregation = None
- Clearing the selection will = Set value to All
- This is important! This resets the parameters.
Now you’re good to go!
Get Started With Interactive Dashboards in Tableau
Check out the live dashboard on Tableau Public. You can download the Tableau File to see the setup. If you’d like to view more of our dashboards in Tableau, please be sure to check out our Analytics Dashboard page! Want to have your dashboards retrofitted with the latest and greatest interactivity? Contact us through the form below!


