We’ve all been there before. We’ve built a snazzy-looking Tableau dashboard that answers all of the stakeholders’ questions but falls short in speed and responsiveness. Sluggish load times can undermine an excellent dashboard’s effectiveness and narrative impact, making users impatient and dissatisfied. In this blog, we will break down essential tips to improve Tableau dashboard performance.
In order to achieve optimal dashboard performance, it’s essential to adhere to best practices throughout the development process. Establishing a load time limit for Tableau content is also helpful and aligns with user expectations and technological capabilities. Ongoing monitoring and refinement of performance enhancements will ensure a consistent user experience.
Understanding Tableau’s Underlying Processes
Before diving into our best practices and tips to improve Tableau dashboard performance, let’s take a step back and consider what Tableau is doing under the hood.
- Tableau is a visual query generator; it translates your designs into queries the underlying data source can understand. When a user loads a dashboard, Tableau compiles queries and sends them to the data source.
- The data source processes those queries and returns the resulting data. Speed here depends on the data source connection type, data source type, and volume of data.
- Tableau uses those query results to perform additional calculations (e.g., window calculations) + any internal calculations it may need to build the dashboard.
- Tableau renders visuals based on the query results and calculations. Speed here depends on the number of marks: more marks, headers, etc. = longer render time.
Data Sources, Workbook Design, and Calculations
Now, here are our tips & best practices to enhance dashboard performance across three levers:
- Data Sources
- Workbook Design
- Calculations
Optimizing Data Sources for Improved Tableau Performance

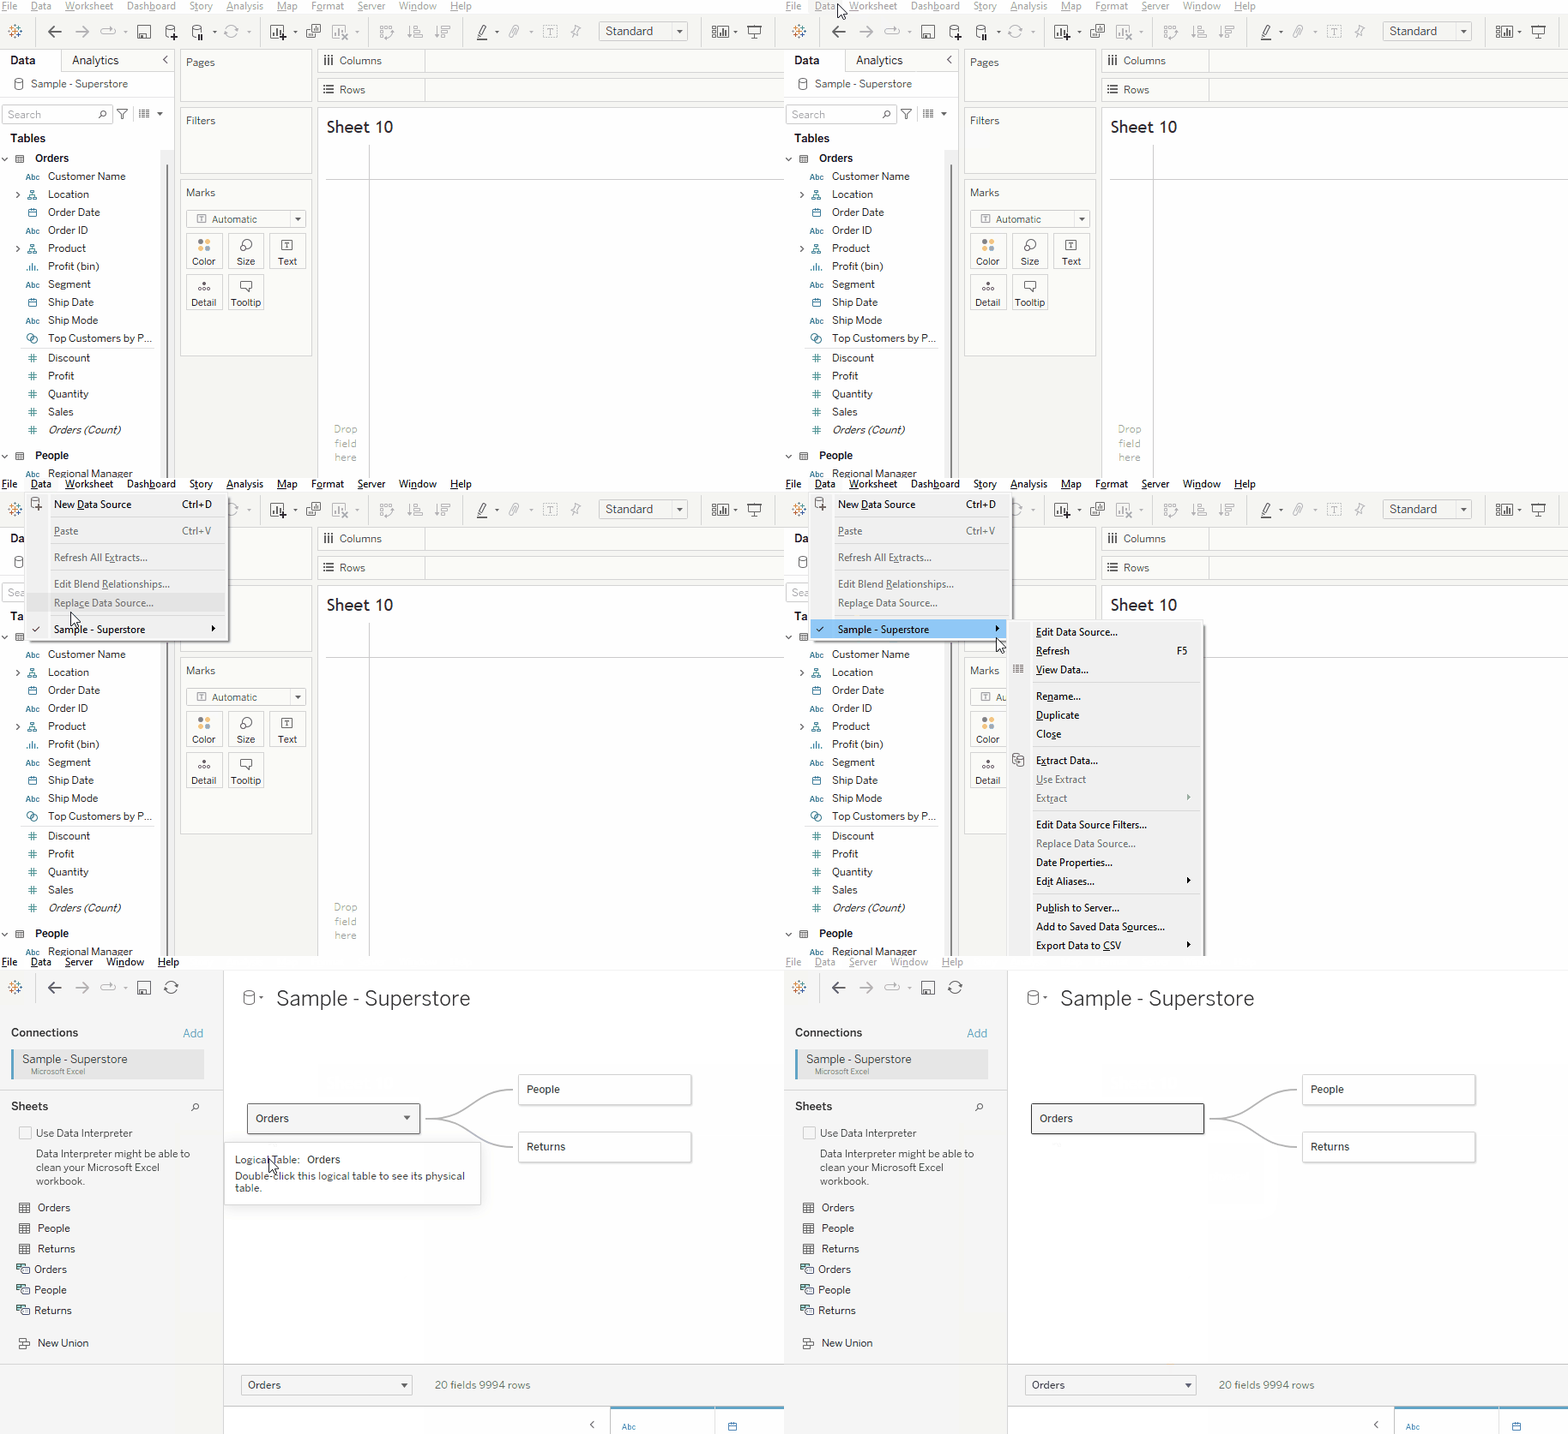
When connecting to a data source in Tableau, you can either utilize a live connection or connect to an extract. A live connection is a direct connection to your source database, queries are processed in that database, and performance is dependent on said database.
An extract is a static snapshot of your live data at a particular moment. Extract queries are processed in Tableau’s memory. When using an extract, you’re limited by the performance of your Tableau Server or Tableau Cloud. The version number matters here, too; keep in mind that features like accelerated views (which load more quickly) are only available in newer Server versions.
Live connections
Within your database:
- Reduce data to only what you need (filter rows and drop columns).
- Index/cluster where it makes sense to do so.
- Materialize row-level calculations in the data source.
- De-normalize tables for common joins (necessary for star schema storage). Note: this is contingent on join cardinality not being few too many.
- Rule out any external issues and address specific performance issues within your control before looking to remediate them (e.g., database speed).
Within Tableau Desktop:
- Use native connectors where possible (vs. ODBC/JDBC connectors).
- Avoid custom SQL. If you need to use it, it’s only worth doing so with an extract (custom SQL with a live connection is extremely slow).
- Avoid cross-database joins; they are extremely slow because Tableau must pull all data in before computing any joins or doing any calculations.
- If you must do a cross-database join, we recommend using extracts.
- Another option is to load the data you need from the secondary source into your main database, so you no longer need a cross-database join.
Extracts:
Extracts are often more performant than live connections, but remember that they are only sometimes appropriate. Consider using an extract when:
- Your dataset is relatively small
- You don’t need real-time data
- Performance is a priority, and your Tableau Cloud or Server is performant enough to handle extracts
When using extracts, use extract filters to reduce the volume of data Tableau brings in.
Any connection:
- Use relationship models where possible instead of creating LODs or other complex calculations. Configure them correctly – correctly configured relationships can be more efficient than joins.
- Use relationships over joins or blends where possible. A relationship only queries the tables it needs based on your view and allows you to work with tables at different levels of detail without creating LODs (which slow things down). A traditional join requires creating a fixed, single, and potentially sizeable logical table. Blends could be more performant because they query each data source independently and on a sheet-by-sheet basis.
Effective Workbook Design for Faster Tableau Dashboards

Use appropriate data types:
- Remember, joining numeric fields is faster than joining string fields.
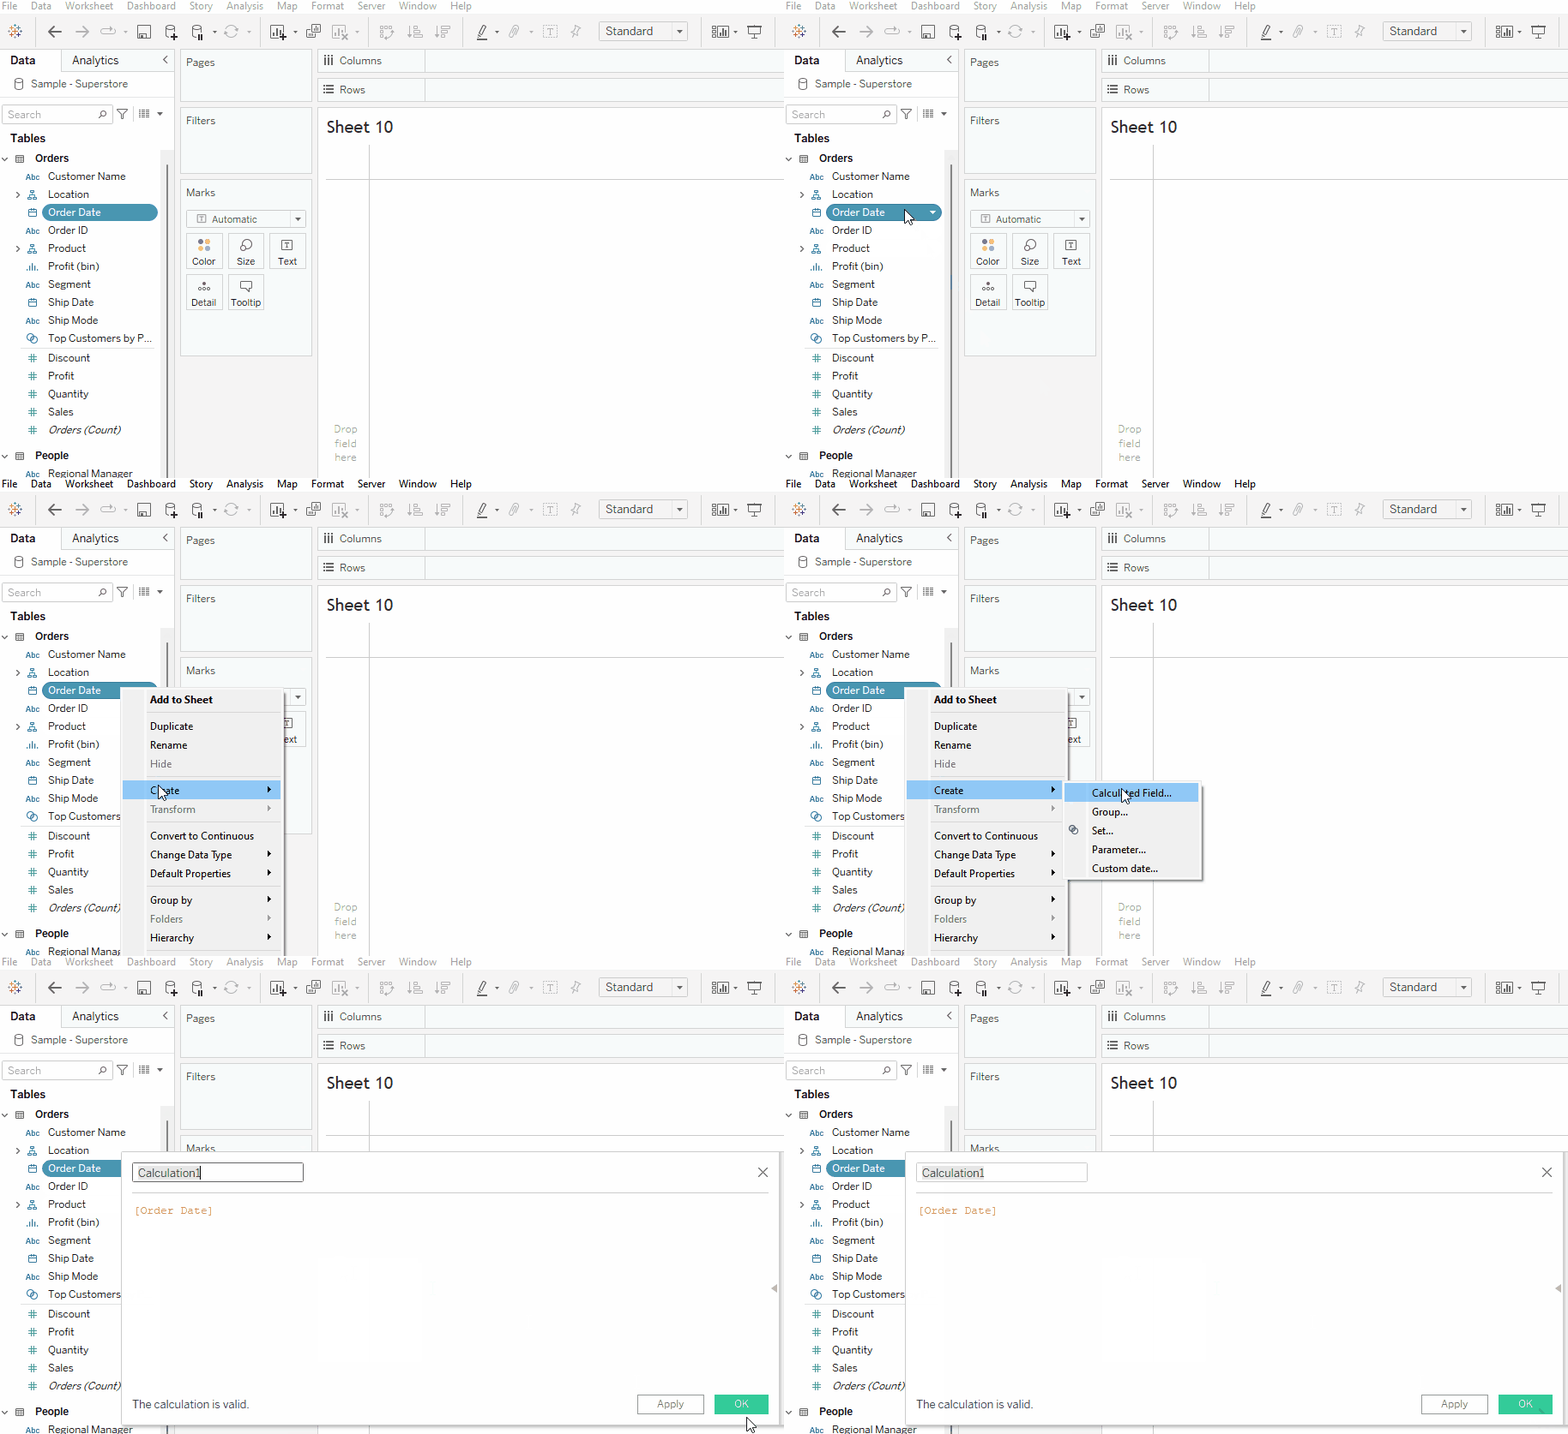
- Store and handle dates as date datatypes instead of strings.
Filtering:
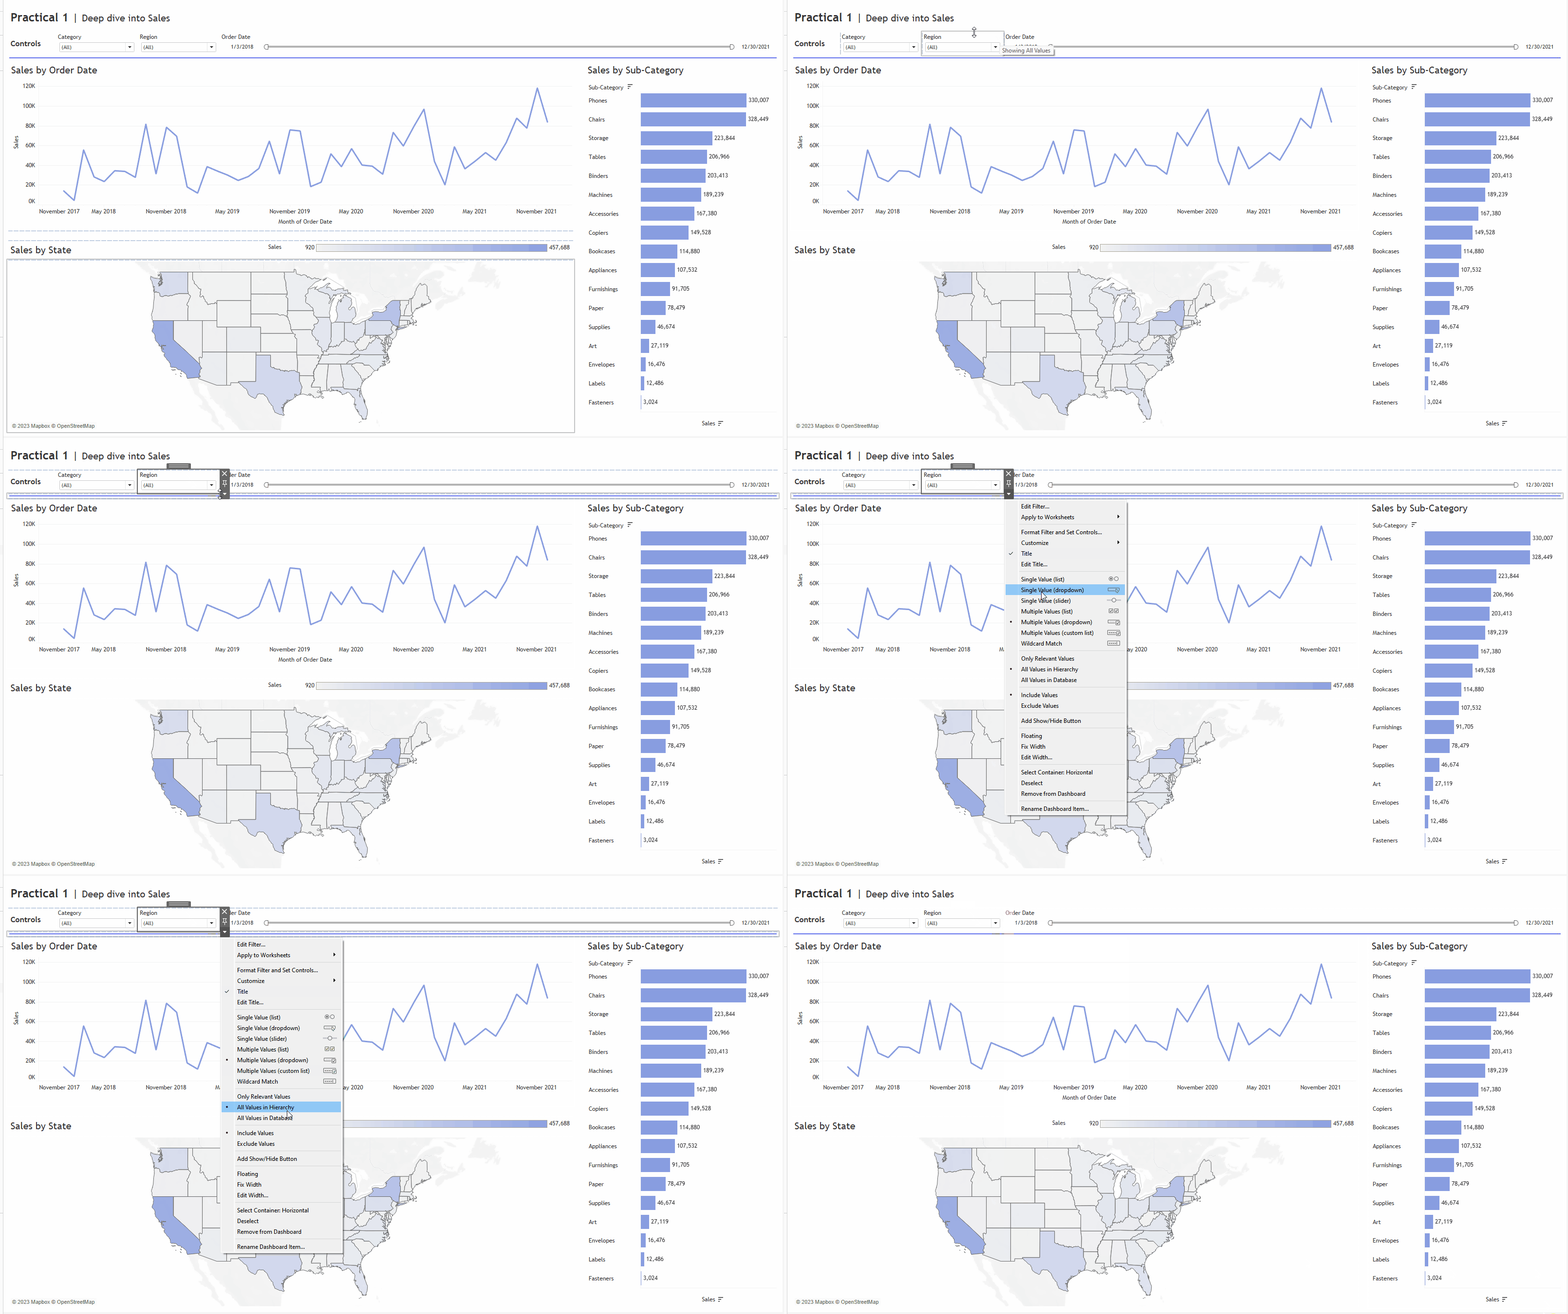
- “Show only relevant values” generates a subquery, which slows live connections. Consider the trade-off between UX and performance here.
- Use the “Apply” button for multi-select filters. This doesn’t impact the performance of a single filter option, but it does reduce the overall wait time for an end user.
- Note: Context filters no longer significantly impact performance and shouldn’t be considered for performance optimization.
- Note: Table calculations are not filtering out any data; they must load all data points first and then hide the marks (rather than genuinely filtering). The initial load will always be slow, but every subsequent filter change will be fast as the data is already loaded, and it’s just changing what’s hidden.
Data Volume:
- Please limit the number of marks in the view (the more marks, the slower Tableau will render them).
- Limiting the number of sheets adds additional queries and requires rendering more marks.
- Consider splitting content into multiple dashboards where appropriate to reduce load times.
- Remove unused sheets from the workbook.
- Use fixed-size dashboard layouts.
- Limit the number of elements in your dashboard (views, visible filters, etc.). Hide information the user doesn’t need to see immediately (i.e., make it more interactive rather than showing everything simultaneously).
- Declutter your dashboard (i.e., accumulation of containers, device-specific settings).
Calculations: Key to Boosting Tableau Dashboard Speed

- Move calculations to the backend data source where possible.
- Reduce calculation granularity where possible (more granularity = longer calculation time).
- Reduce the number of referenced dimensions in the calculation where possible.
- Avoid nested calculations.
- Use AND conditions rather than nesting IF statements.
- Use MIN/MAX instead of ATTR/AVG where possible.
- Use COUNT instead of COUTND where possible.
- Use date functions on dates instead of string functions.
- Don’t overuse LODs and table calculations; use regular aggregate calculations where possible.
- Ways of creating groups from most to least performant:
- CASE statements
- Sets
- Native “Group” functionality
- IF/ELSE statements
- Use IN instead of OR when you need a list of values to be true.
- When using parameters inside calculations, use aggregates where it is possible.
- CASE [parameter] / WHEN 1 THEN SUM([Sales]) rather than SALES
Partner with Aimpoint Digital to Optimize Tableau Dashboard Performance
Optimizing your Tableau dashboard performance is a multifaceted process, but you don’t have to navigate it alone. At Aimpoint Digital, our team of experts is ready to help you enhance the speed, responsiveness, and overall effectiveness of your dashboards. Remember, a well-performing dashboard is not just about speed—it’s about delivering the right information at the right time to drive informed decision-making. Don’t hesitate to reach out to us for assistance or to learn more about our services.


