
At Aimpoint Digital, we have partnered with Dataiku, a data science software company, to deliver data science solutions such as productionized machine learning models using Dataiku’s Data Science Studio (DSS). However, DSS is also a powerful analytics platform that can provide value to your analytics team today, even if productional machine learning models are far on the horizon for your team.
This blog will explain how Dataiku DSS can add value to your analytics team by highlighting seven key features that make Dataiku DSS a strong contender as an analytics platform.
The 7 features of Dataiku that we will discuss are:
- A Centralized Collaboration Homepage
- Visual Transformation
- Database Compatibility
- Automation Through Scenarios and Triggers
- Quality Control
- Code Flexibility
- Reporting and Visualization
A Centralized Collaboration Homepage
As analytics teams grow, it becomes increasingly important to have clear and robust ways to document and collaborate.
Dataiku DSS was built with this in mind, allowing for real-time collaboration in a centralized portal through the Project homepage. The Project homepage provides a high-level view of all assets (input and output datasets, database connections, documents, wikis, dashboards, and other files related to the project) available for that project. Users can view current and past versions of work (and revert between them), review tasks, start discussions, and add assets such as dashboards and wikis to share with other users. Of course, administrators can also set permissions according to user groups or even by individual assets. Further, since everything is in a centralized location, developers can build and collaborate in real-time, without the need to push changes or transfer assets outside of DSS.
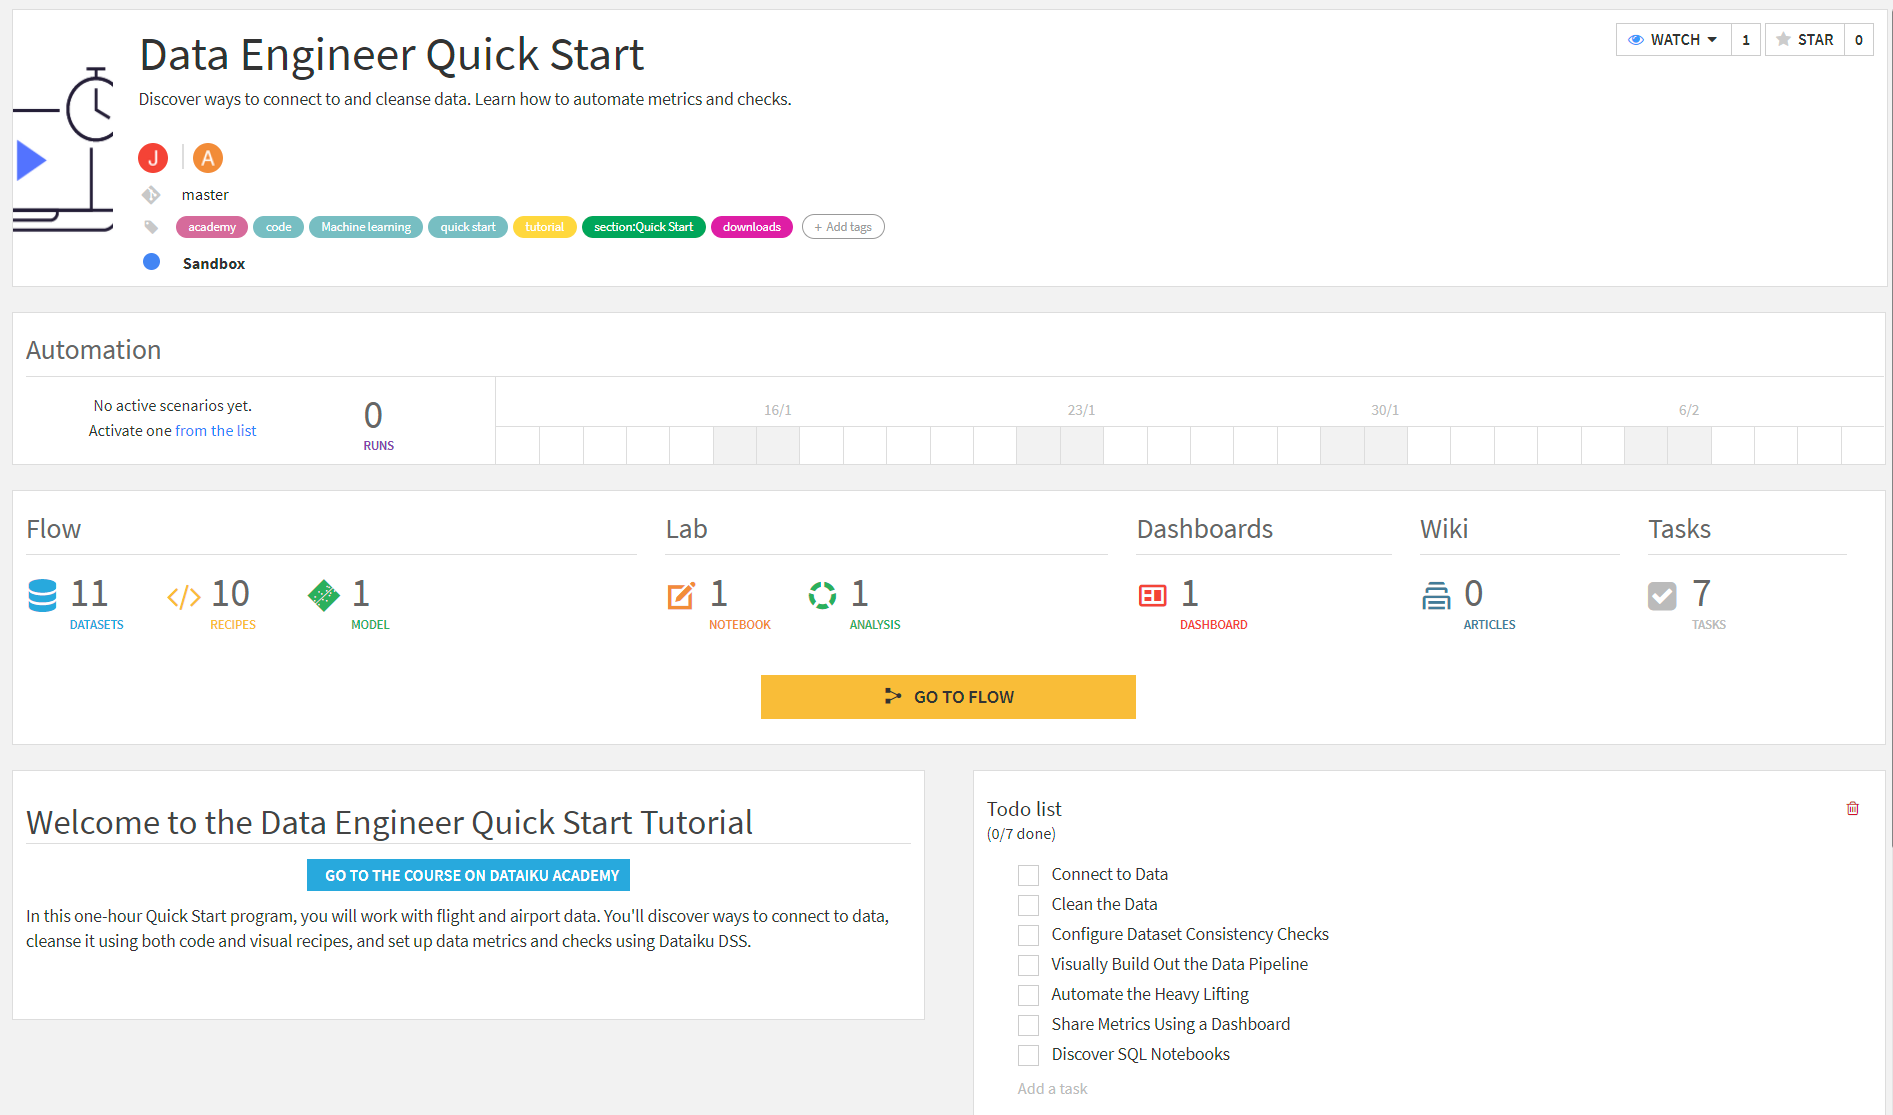
The Project homepage provides a high-level view of all assets available for a DSS project and has built-in functionality for collaboration.
Visual Transformation
One of Dataiku DSS’s key analytics features is its dual capability to transform large datasets and visualize these transformations. DSS’s “Flow,” pictured below, is a diagram of all the datasets and transformations involved in the project and how they are connected. The Flow allows you to see all your input, output, and intermediate datasets along with all the steps called “Recipes” used to transform your data. It is also possible to color-code each element based on different characteristics, such as the environment where the recipe is being run or the manual tags applied to each tool. Lastly, Flow Zones allow you to separate parts of your Flow related to each other for visual organization.
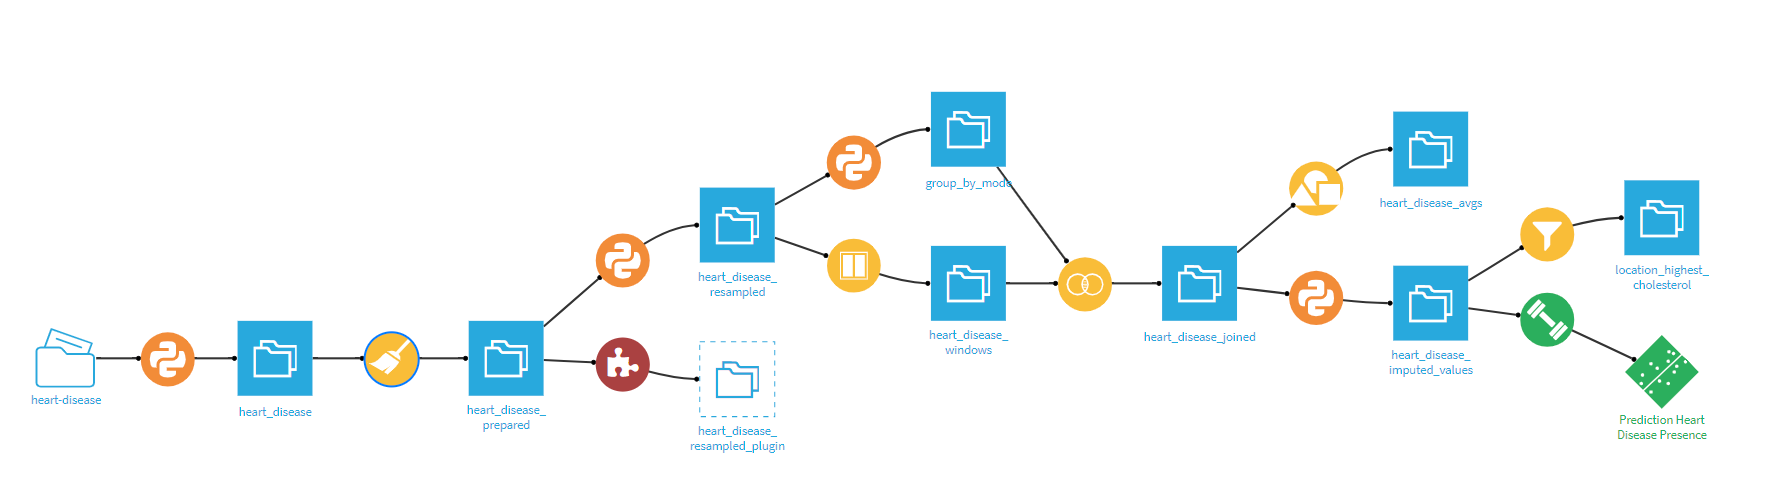
A typical Dataiku flow with input/output datasets (blue squares), Python code recipes (orange circles), and Visual Recipes (yellow circles).
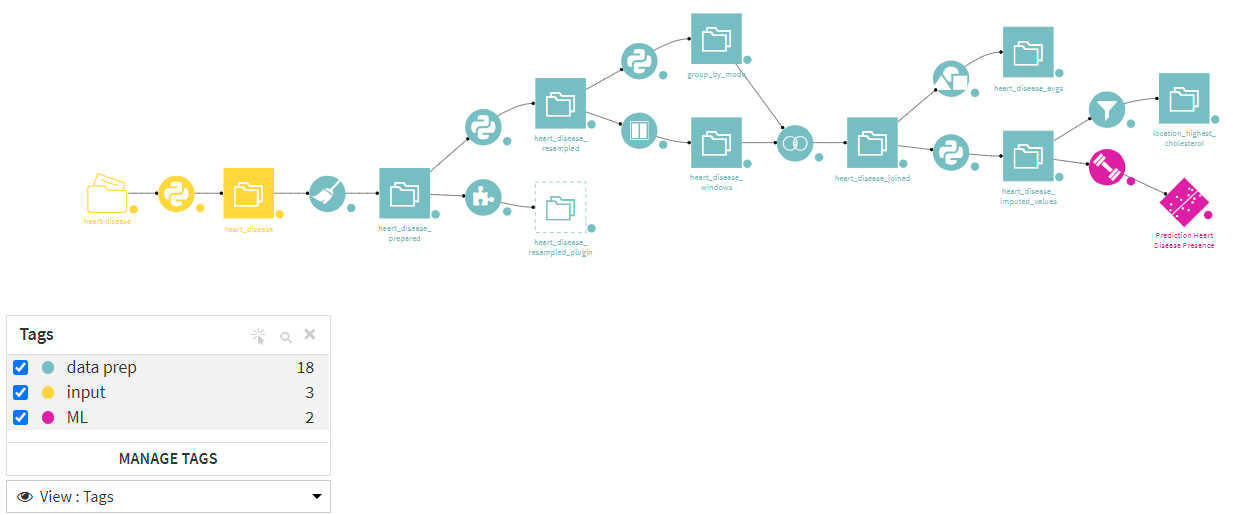
The same flow as above, color-coded by user-configured tags.
Of course, the real power of Dataiku DSS comes with the wide selection of powerful Visual Recipes that come out of the box. DSS’s Visual Recipes cover the most common data transformations and are a polished, low-code way to enable data preparation across the organization. The Prepare recipe, for example, comes with a gamut of processors for parsing text (including Regular Expression) or custom calculations. Other recipes allow for your typical joining, filtering, and aggregating data. The availability of processors and tools provides a wide range of capabilities for transforming and blending data. The user-friendly visual interface of DSS makes it easy for users to navigate and visualize everything going on in their Flow.

A list of the Visual Recipes available in Dataiku DSS 10.
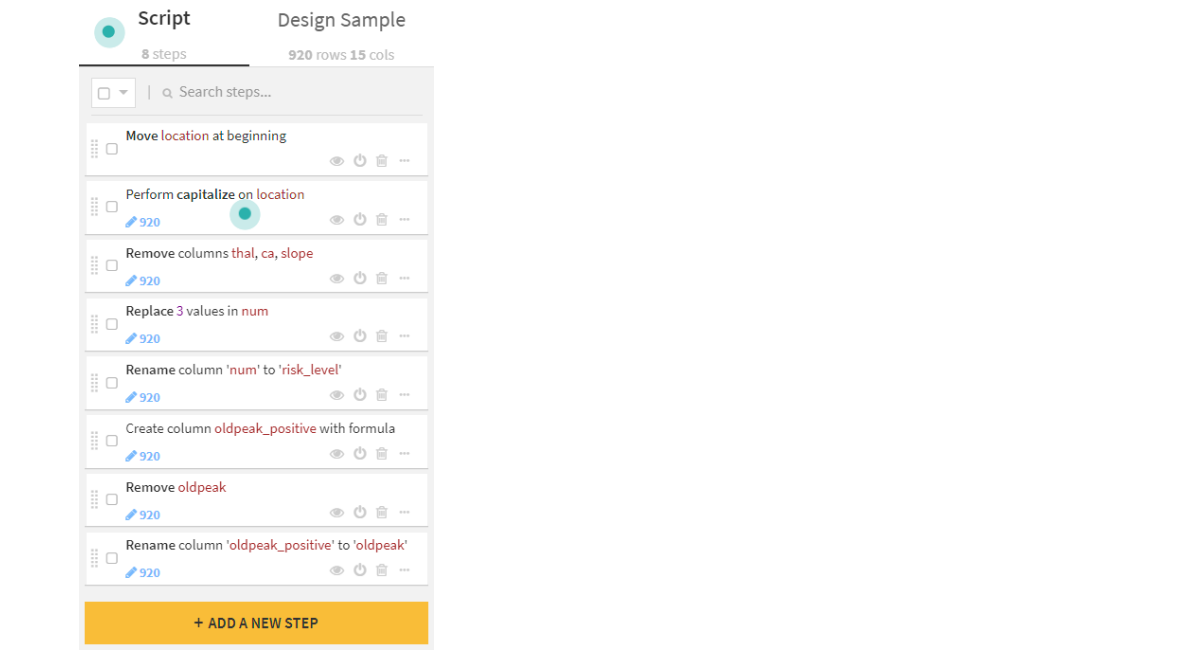
Example of steps that are possible in a prepare recipe.
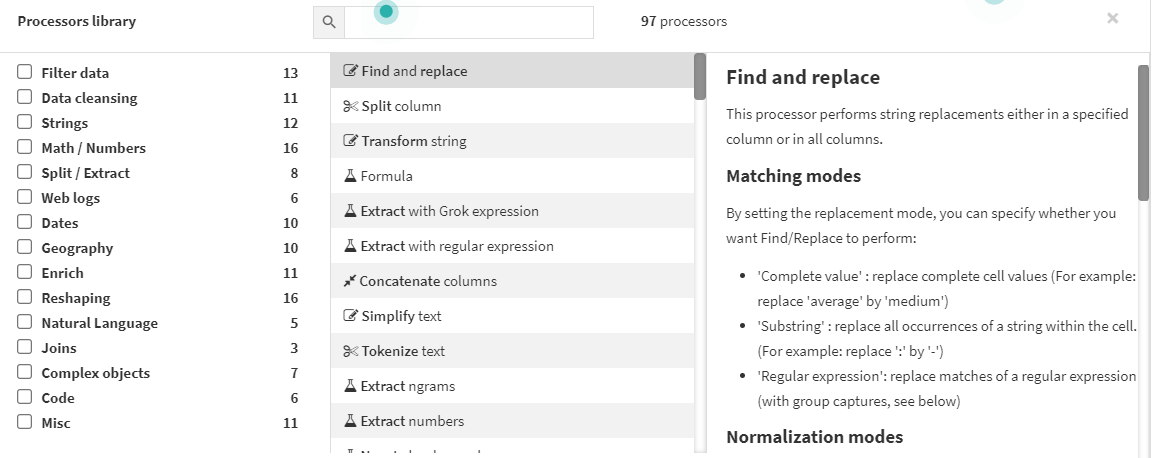
View of available processors within the Prepare recipe and documentation and examples of each processor.
Database Compatibility
One necessity of any analytics organization is blending and combining data from different sources. Dataiku DSS natively supports database technologies, cloud storage platforms, and non-relational databases (NoSQL) with built-in connectors. Custom connectors can be installed via the Dataiku plugin store for platforms that are not supported out of the box. DSS also offers a host of plugins for generic APIs and custom code options to build more niche connectors.
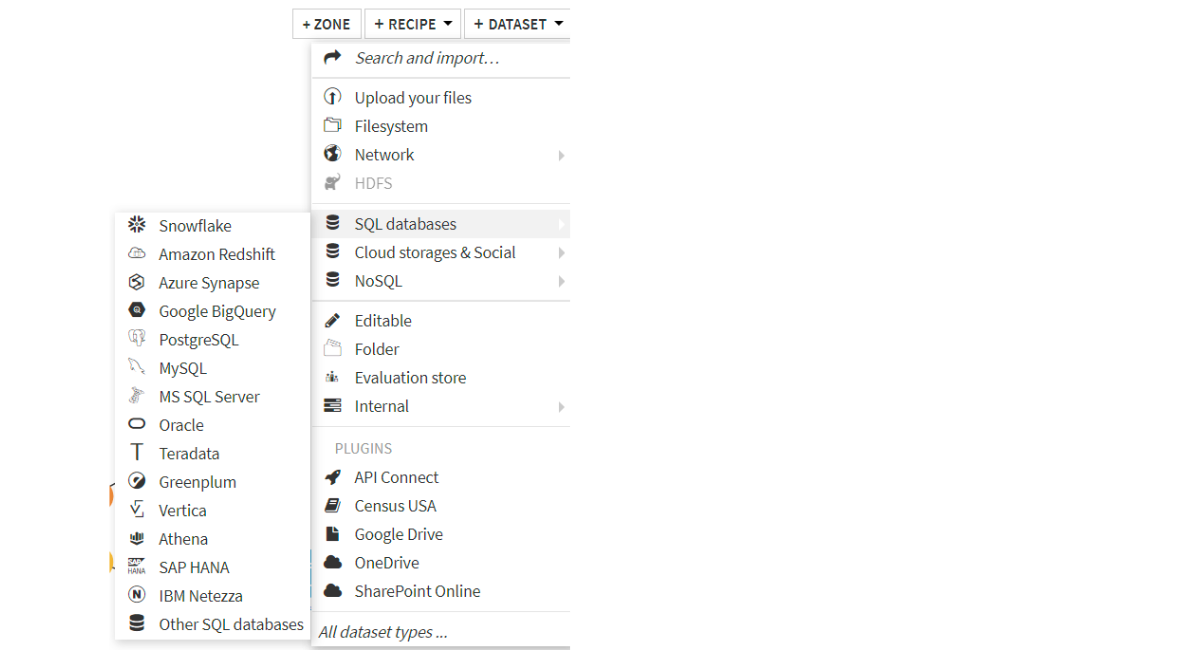
Short list of example SQL databases natively compatible in DSS. DSS can also connect to Cloud Data Lakes like S3 and NoSQL databases such as MongoDB.
An added benefit of DSS’s database compatibility is the ability to specify the engine in which certain recipes are run. DSS supports Spark, SQL in-database, or DSS streaming engines for running recipes, which allows for performance tuning of computationally expensive tasks. Natively supported Visual Recipes and Code Recipes can be run on different engines without reconfiguring the recipes – that is, no code needs to be rewritten when changing a Prepare recipe from running via DSS to running in-database.
Automation through Scenarios and Triggers
A critical aspect of any analytics tool is automation, the ability to run and schedule tasks without manual interaction. Dataiku DSS builds out its automation functionality through features called Scenarios and Triggers. Dataiku DSS’s Scenarios are a series of steps to be executed in a particular order and are initiated by events called Triggers. Triggers can be anything from a simple daily schedule to waiting for a data change in a table on the data warehouse. DSS offers a selection of triggers to cover most use cases, but triggers can be custom configured with code for truly niche situations. Once triggers are configured, you also have full control over the steps that are run in your scenario, the order that those steps are run, and any dependencies between steps. Steps can be anything from building datasets, updating project variables, or performing checks. In all, the ability to schedule, set dependencies, run events, and chain flows make automation a breeze in DSS.
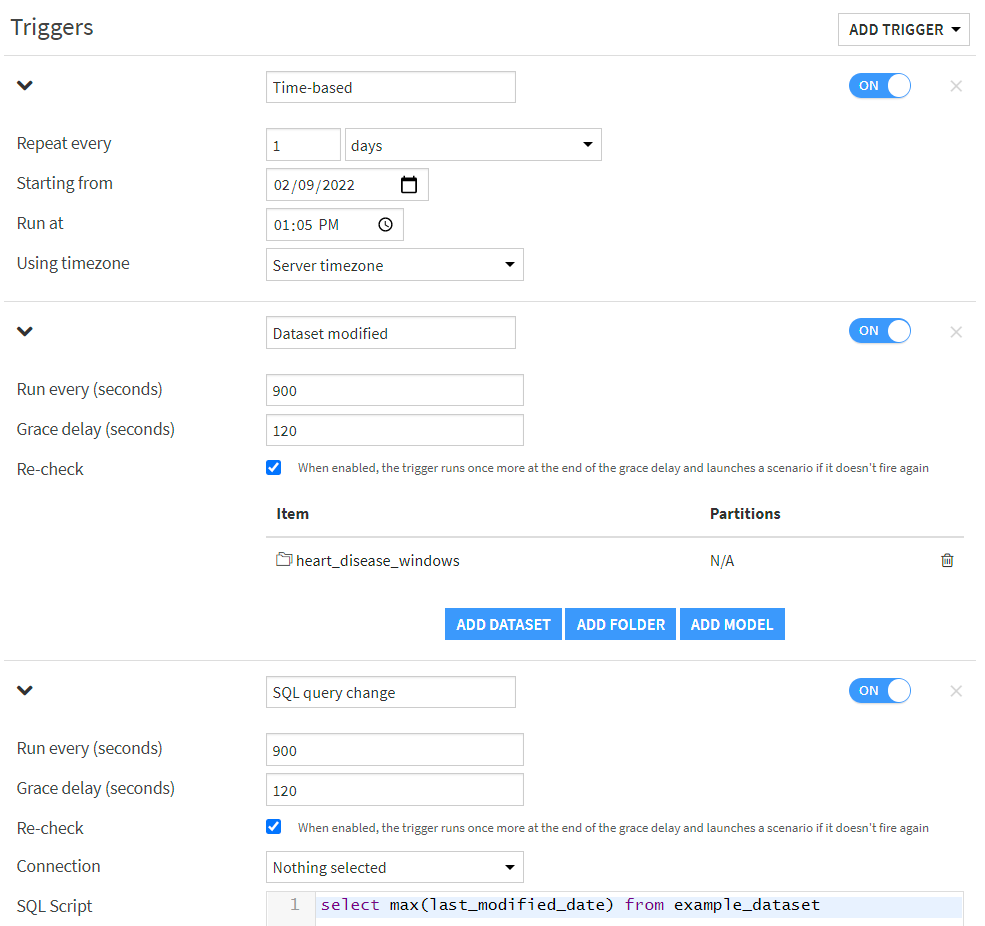
Example of the different trigger options for Scenarios. Not pictured: custom triggers with a Python script.

Once a scenario is triggered, you can configure the steps to run and in which order.
Quality Control
Getting clean and accurate data is a challenge that all analytics teams face, and Dataiku DSS makes this far less challenging with quality control steps throughout the Flow. Upon opening any dataset, you will first notice that columns will be flagged by a color-coded bar to immediately point out any data quality issues. You can dig deeper into these data quality issues by opening DSS’s “Analyze” window, where you can explore different options for resolving those issues, such as by imputing values or omitting records altogether.
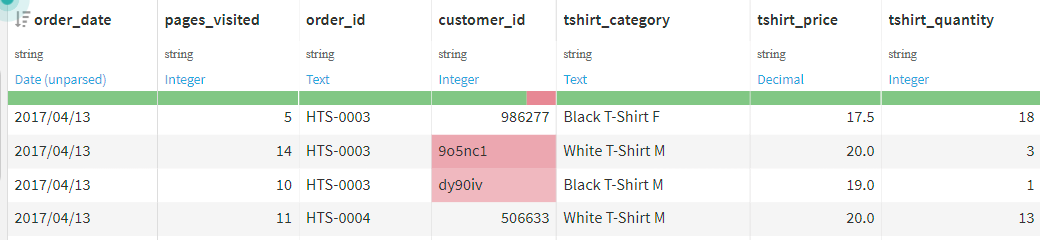
Upon opening a dataset, DSS will color-code each column to flag null and empty records for each column, such as customer_id in this dataset.
Additionally, built into each dataset is the option to create Metrics and Checks. Metrics are calculations about a dataset that are computed each time that dataset is rebuilt in DSS and can be anything from column and record counts to most frequent values or percentiles for particular columns. Checks are another DSS function built on top of Metrics, and are used to flag if there are any issues with the dataset. For example, you can set a minimum record count for a dataset as a Check, and whenever the Check fails, you can control what downstream elements of the Flow are impacted. Metrics and Checks also complement the robust Automation engine in Scenarios mentioned previously.
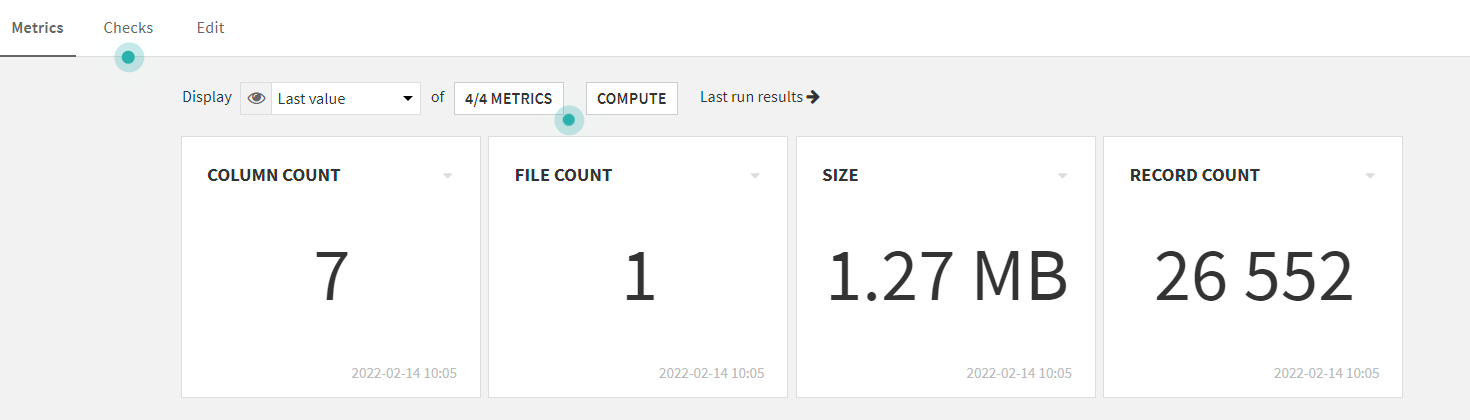
A view of some common metrics that are computed with each dataset.
Code Flexibility
As mentioned before, one of Dataiku’s core value adds is the capability to perform powerful and ubiquitously utilized data transformations with low/no-code Visual Recipes. However, for the more technical analysts and data scientists, Dataiku offers capabilities for more custom transformations in Python, R, and SQL. Users can write custom Code Recipes to transform datasets at any point in the project flow, separately from or in combination with the out-of-the-box Visual Recipes included in DSS. Custom code can also be used to configure triggers and scenarios for additional control over automation.
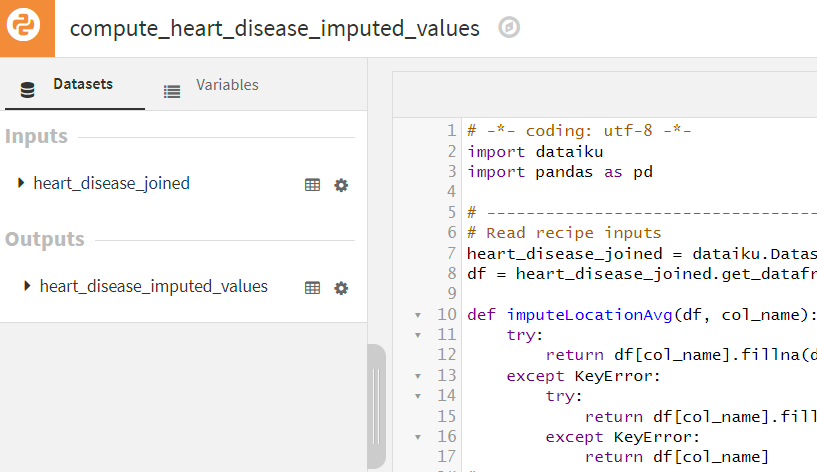
Custom code can be fully integrated within any DSS flow through code recipes.
Reporting and Visualization
Of course, an important objective of most analytics organizations is reliable reporting. It is worth mentioning that while Dataiku DSS is not a dedicated business intelligence (BI) tool, Dataiku DSS does have some native reporting tools such as dashboards, web apps, R Markdown reports, flat-file outputs (e.g. Microsoft Excel), and even automated and formatted email reports. Further, DSS integrates visual elements throughout the flow, including interactive statistical visualizations for output datasets, which are helpful for quality assurance during the development process.

Users can create interactive dashboards to explore the data within a DSS project.
However, DSS’s strength as an analytics tool is in its data prep and automation capabilities, and to cover reporting and visualization, DSS makes connecting to third-party BI tools a seamless process. DSS has connectors to the most common third-party BI tools, including Tableau, PowerBI, QilkSense, and QlikView.
Aimpoint Digital and Your Dataiku Analytics Journey
We have gone over some of the key features of Dataiku DSS that make it a highly capable analytics platform. Namely, the powerful low-code visual transformations along with third-party compatibility, automation, code flexibility, and reporting, among other features, make DSS a more than capable analytics software option for all kinds of organizations.
If you are interested in learning more about how Aimpoint Digital can help you get started with Dataiku DSS, contact us through the form below.
At Aimpoint Digital, we have partnered with Dataiku, a data science software company, to deliver data science solutions such as productionized machine learning models using Dataiku’s Data Science Studio (DSS). However, DSS is also a powerful analytics platform that can provide value to your analytics team today, even if productional machine learning models are far on the horizon for your team.


