

Why is this important? Here’s an example. You are the operations team and presenting a quarterly review of the Emergency Room performance. Your stakeholder asks, “Which day had the lowest Customer Satisfaction?” If you were presenting a static PowerPoint, you might have to take that question offline, do your analysis, and follow up with an Excel analysis at least by EOD, but at most by the following week.
Now, say you build out a customer satisfaction review dashboard in Tableau. Your stakeholder always asks about highs and lows in a selected period. You add a dashboard action to filter for the lowest scores, and your stakeholder can now see trends over time and demographics. That’s an actionable dashboard!
In this blog, I will explore how to turn an average dashboard into an actionable one.
The Use Case:
- Build a dashboard for the ER
- Intake data from the past two years are available
- The stakeholder is interested in understanding more about
- Patient demographics, specifically from last week
- Customer satisfaction scores
The Starting Point:
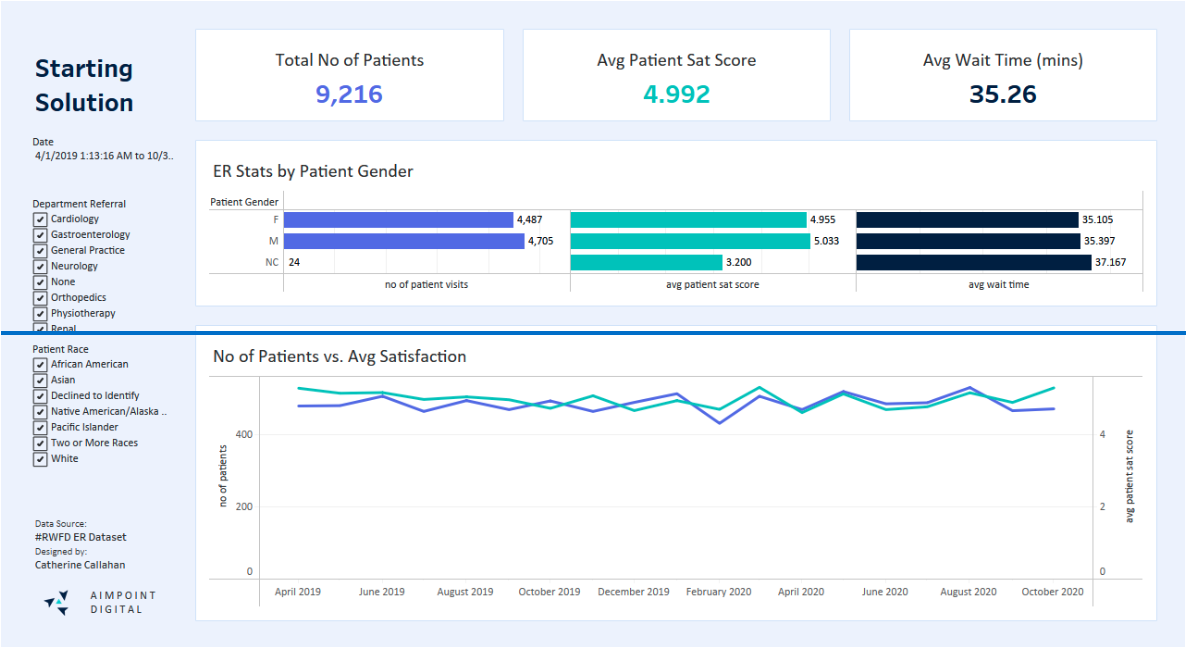
With the requirements in mind, I created the following dashboard:
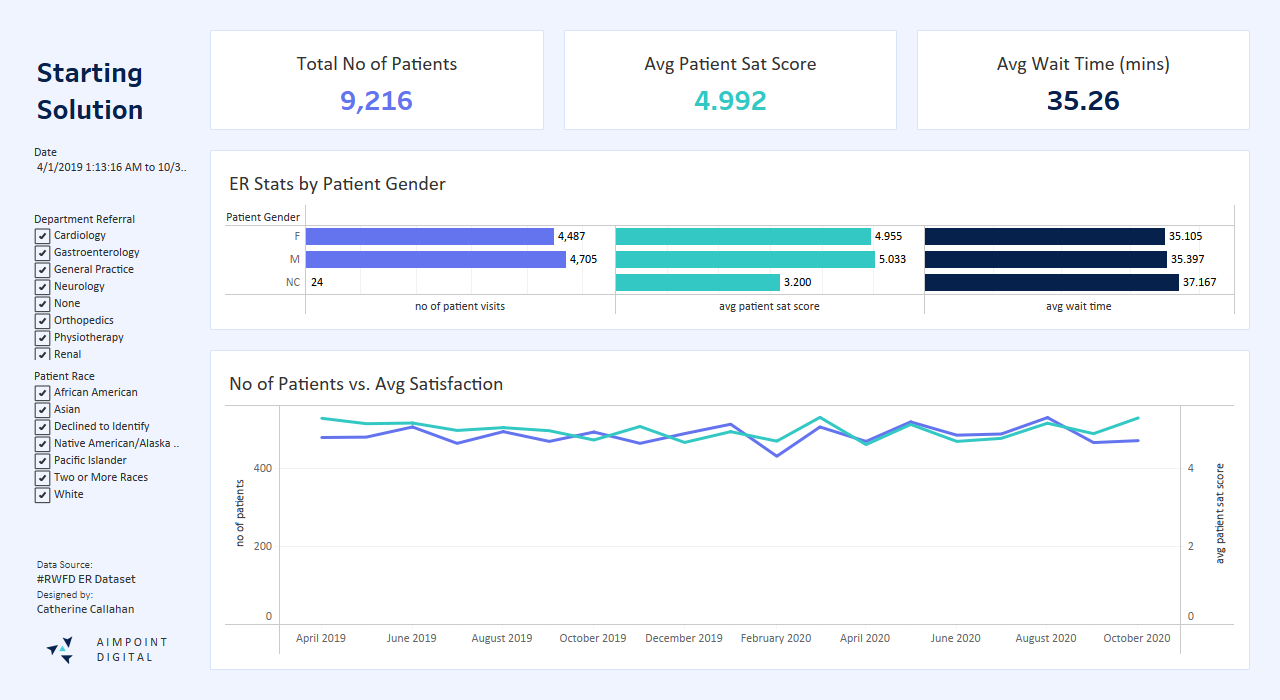
While this dashboard is usable, its design choices hinder interpretation and action. To highlight a few design issues:
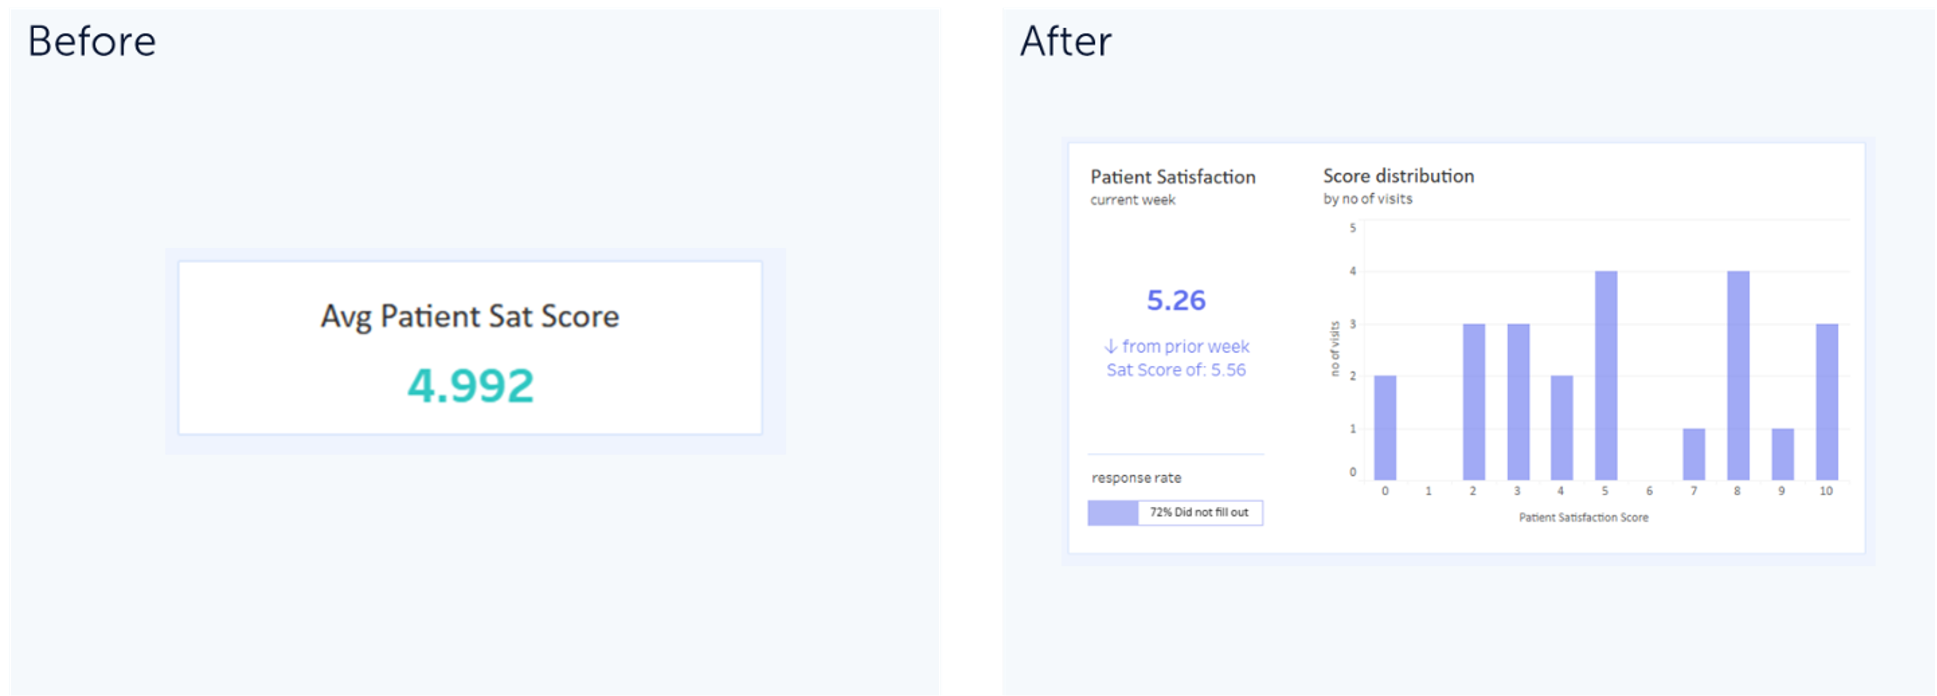
- KPIs are too general with no context
- The timeline shows all time, while the stakeholder is interested in the last week
- It is not clear that many patients do not fill out the survey
- We don’t understand the distribution of scores based solely on the average score number
- While the filters are centralized, the multi-select configuration is not as great for functionality & design
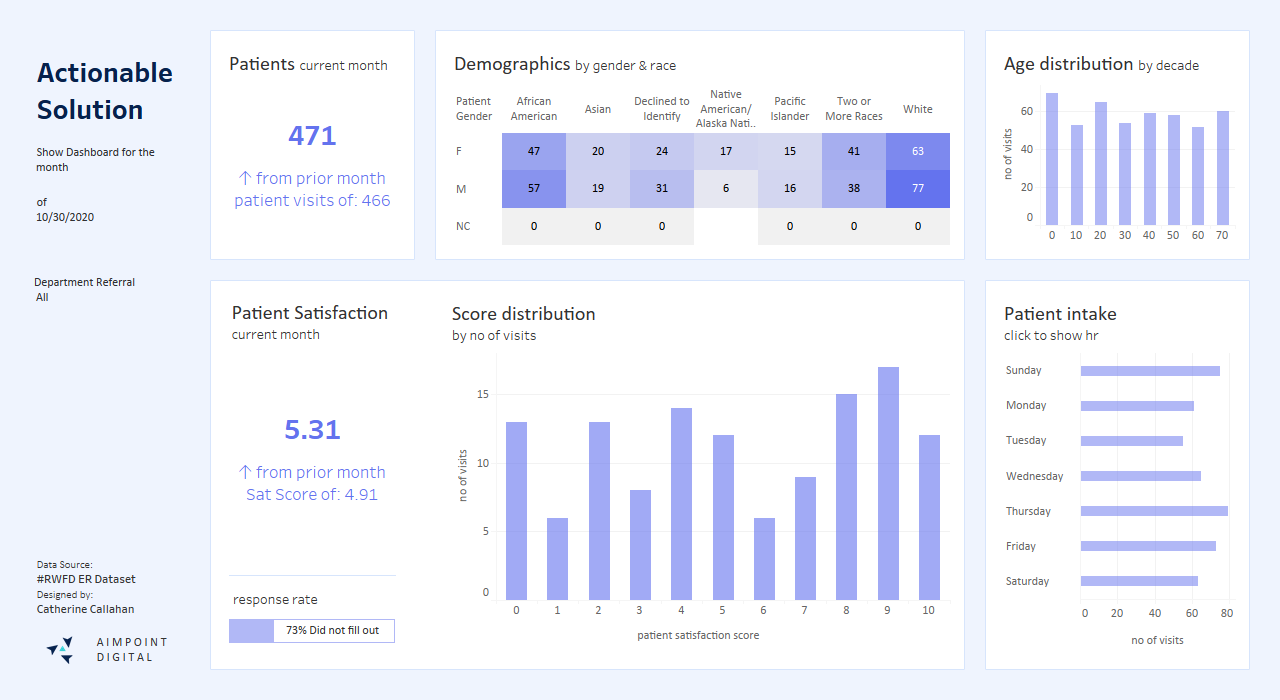
I made a few design adjustments with the end user in mind
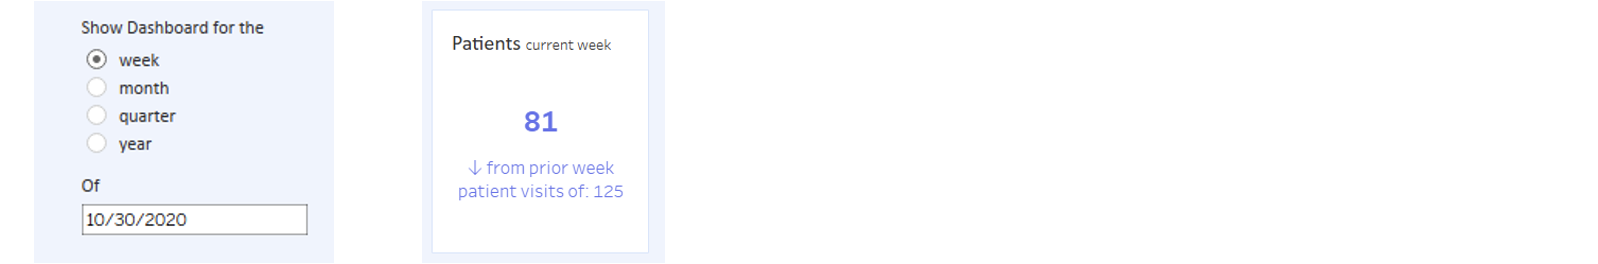
- Added dynamic date periods so that the end user can see the data by week, month, quarter, or year

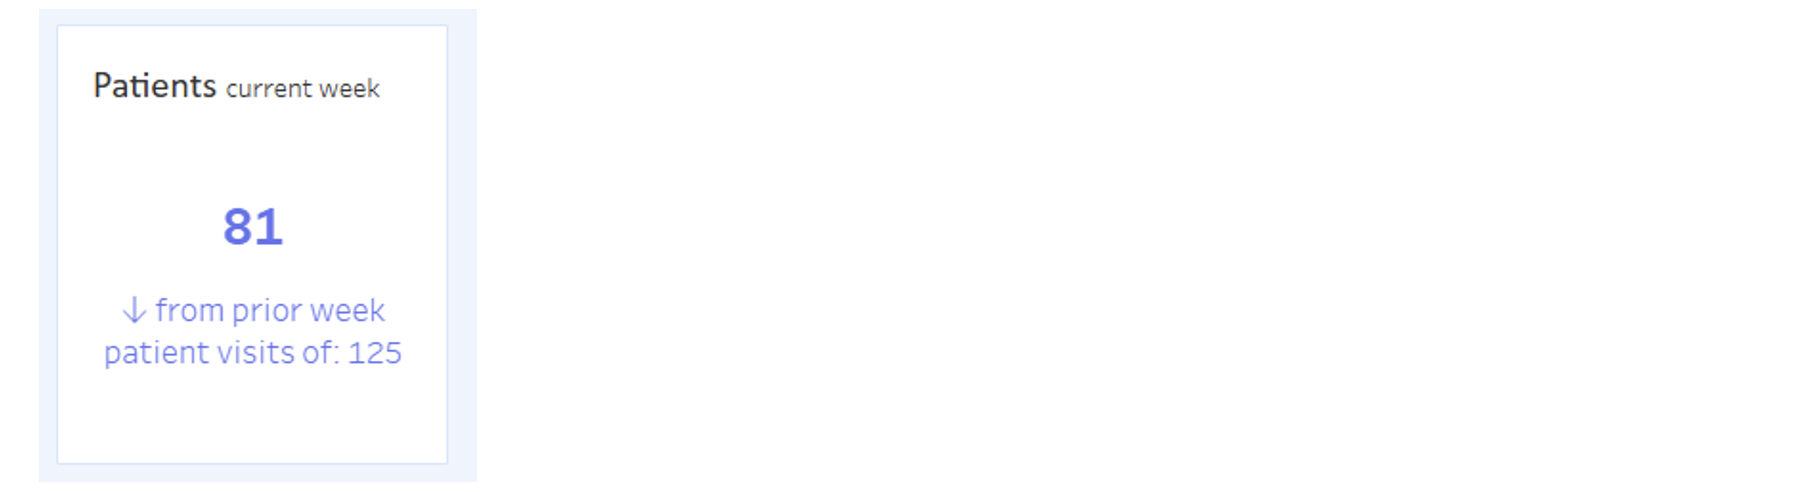
- Thanks to the dynamic date periods implemented, I could easily add context to the KPIs to show the delta from the prior period.

- I added more visualizations focused on demographics, as that was of interest to the stakeholder.
While the original dashboard provided patients’ gender breakdown, other dataset fields can help us get a more granular view of the hospital’s demographic. Using the heatmap chart, we can see the volume of patients split not only by their gender but also by race.
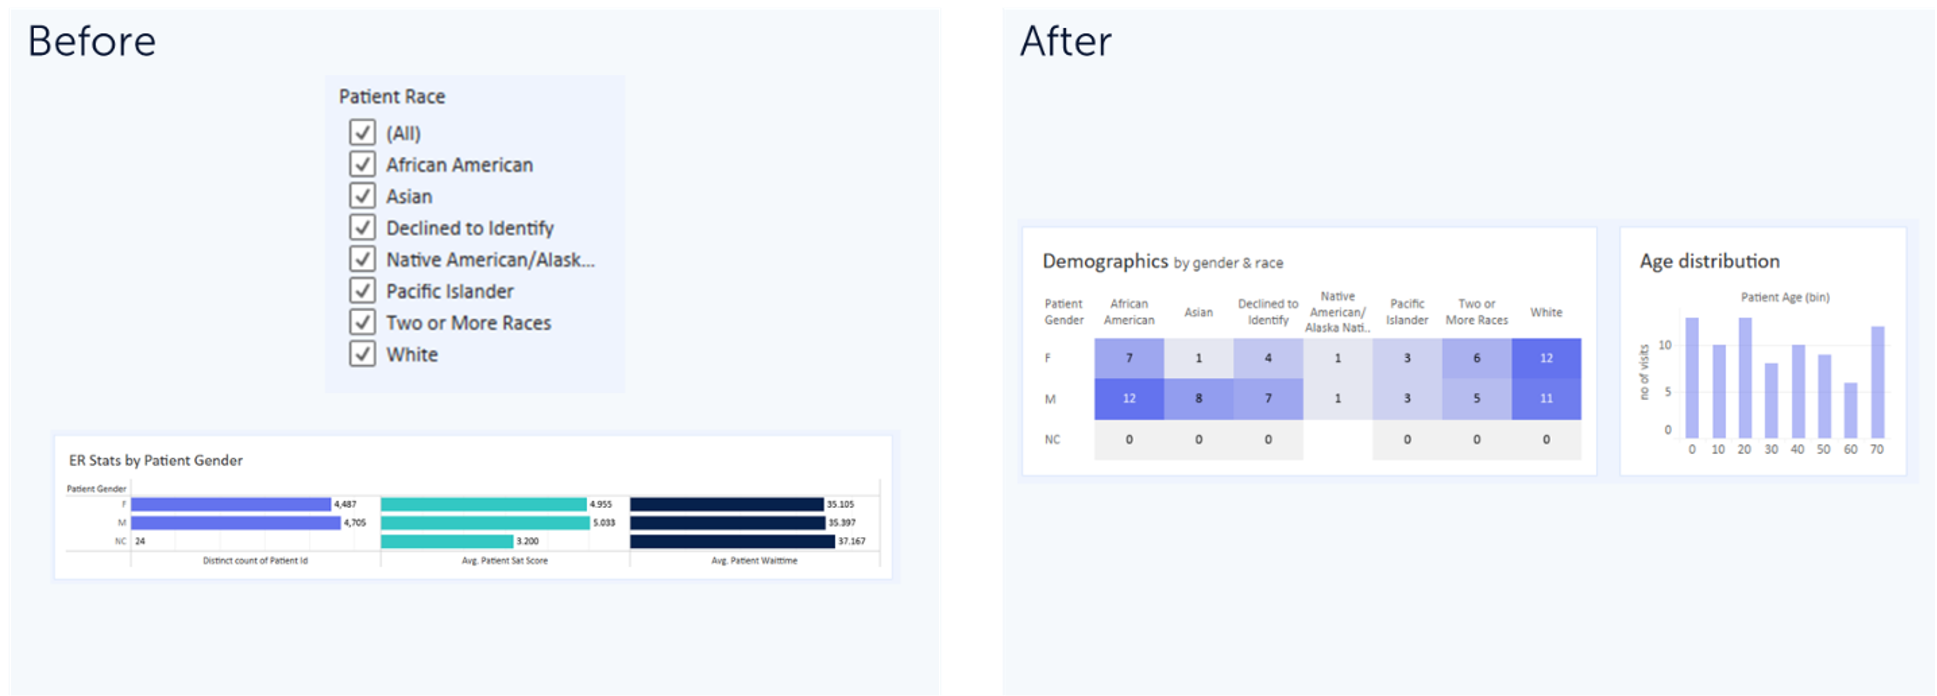
- Added interactions across views
Let’s examine how I implemented Dynamic Dates to create actionable visualizations.
This methodology is my favorite way of handling dates in Tableau, especially in business use cases. It allows the user to switch between week, month, quarter, etc. quickly and makes calculations a breeze.
It works as follows:
- The current period defines the [Date Level] of the [Date As At]
- If the Date As At is October 30, 2020, and Date Level is Week, then the current period is the week of October 30, 2020
To set up:
- Create a “Date As At” parameter
- Data type = Date
- Tip: you can set the “Value when the workbook opens” option to be the latest date in the dataset if the data source updates on a cadence

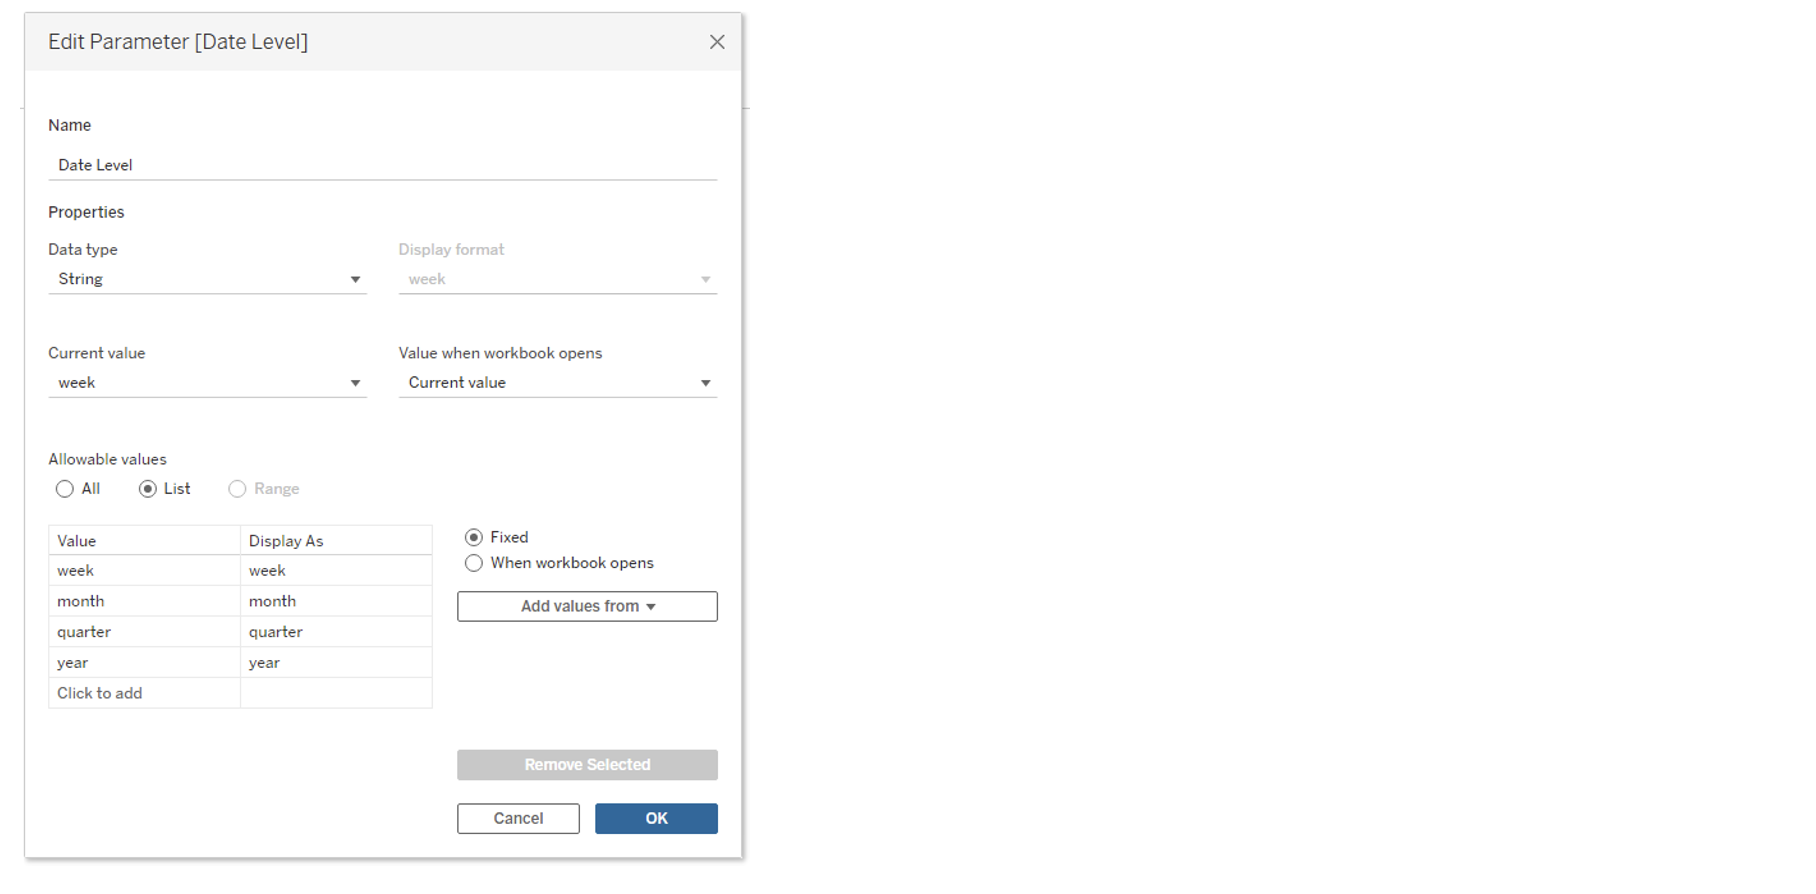
- Create a “Date Level” parameter
- Data type = string,
- Set a list of allowable values, as shown below
- Make sure to set these values in the format suitable for Tableau’s DATATRUNC formula, i.e., “week,” “month,” etc.)
- Create a field called isCurrentPeriod
- This will give a True/false result to indicate whether the row is in the defined current period
- isCurrentPeriod = DATETRUNC([Date Level],[Date As At])=DATETRUNC([Date Level],[Date])
- Create a field called isPriorPeriod
- This will give a True/False result to indicate whether the row is in the previous period based on the selected values in the [Date Level] and [Date As At] fields
- You can create many ranges with this methodology, including YTD, QTD, Last [N] [Months]
Once created, your isCurrentPeriod and isPriorPeriod fields can drive the dashboard in 2 ways:
- Used in Filters on Sheets
- Pros: Easy to implement, can be applied to multiple sheets
- Cons: Will filter out values that do not appear in the selected period
- For example, if all ER patients in a selected week were females (F), the system will filter out the rows for other genders (M and NC) from the Demographics chart
- Used in Calculated Fields
- Pros: easy to understand, no filter required on the worksheet, and you can easily create delta fields to show the difference between the prior period and the current period
- Cons: you’re creating many calculated fields
Now you know how to add dynamic date selections in Tableau and allow your end users to analyze how the data changed compared to the previous period.
BONUS TIP: Use Unicode symbols in your formulas. That’s how I created this Arrow in the Patients’ KPI.
IF [Current No of Patient Visits]>[Prior No of Patient Visits] THEN “↑“
ELSEIF [Current No of Patient Visits]<[Prior No of Patient Visits] THEN “↓“
ELSE “” END
In summary, I covered how to create user-friendly KPIs, accessible and intuitive filters, and dynamic date periods in Tableau, along with a bonus Unicode character tip. I hope this helps you on your development journey. If you have any questions, check out how I did it by downloading the dashboard from our Tableau Public. Please reach out if you would like to learn more about how Aimpoint Digital can support your Actionable Insights transformation journey. Many Tableau dashboards show data, but only some know how to present data in an actionable way for the end user. Start by clarifying the questions the report’s audience needs to answer and use them as guidance when building actionable insights with Tableau dashboards.
Author


