Analytics dashboards
Discover expertly crafted dashboards developed by our team.
Get Dashboard Support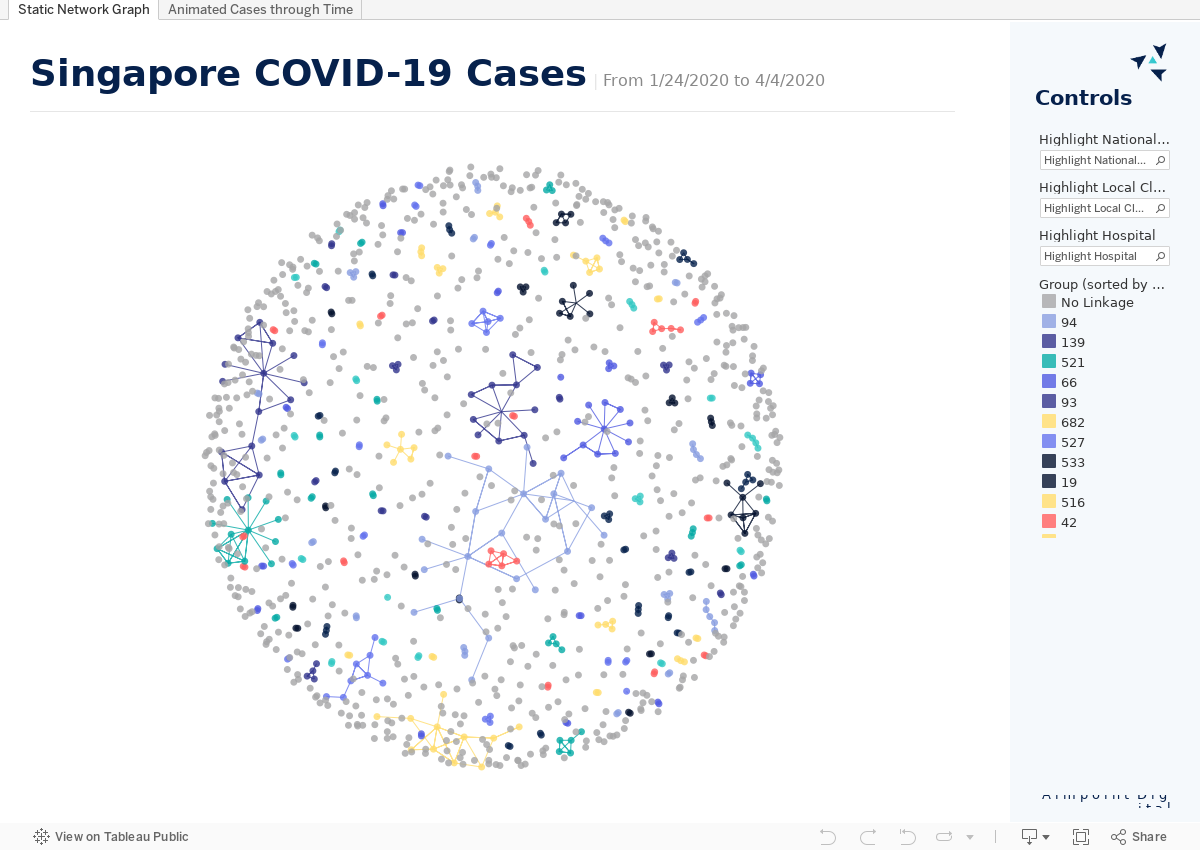
COVID-19 Network Analysis
A network graph of known COVID-19 cases in the country of Singapore as of April 04, 2020 that highlights known links between cases.
Data provided by Ministry of Health, Singapore.
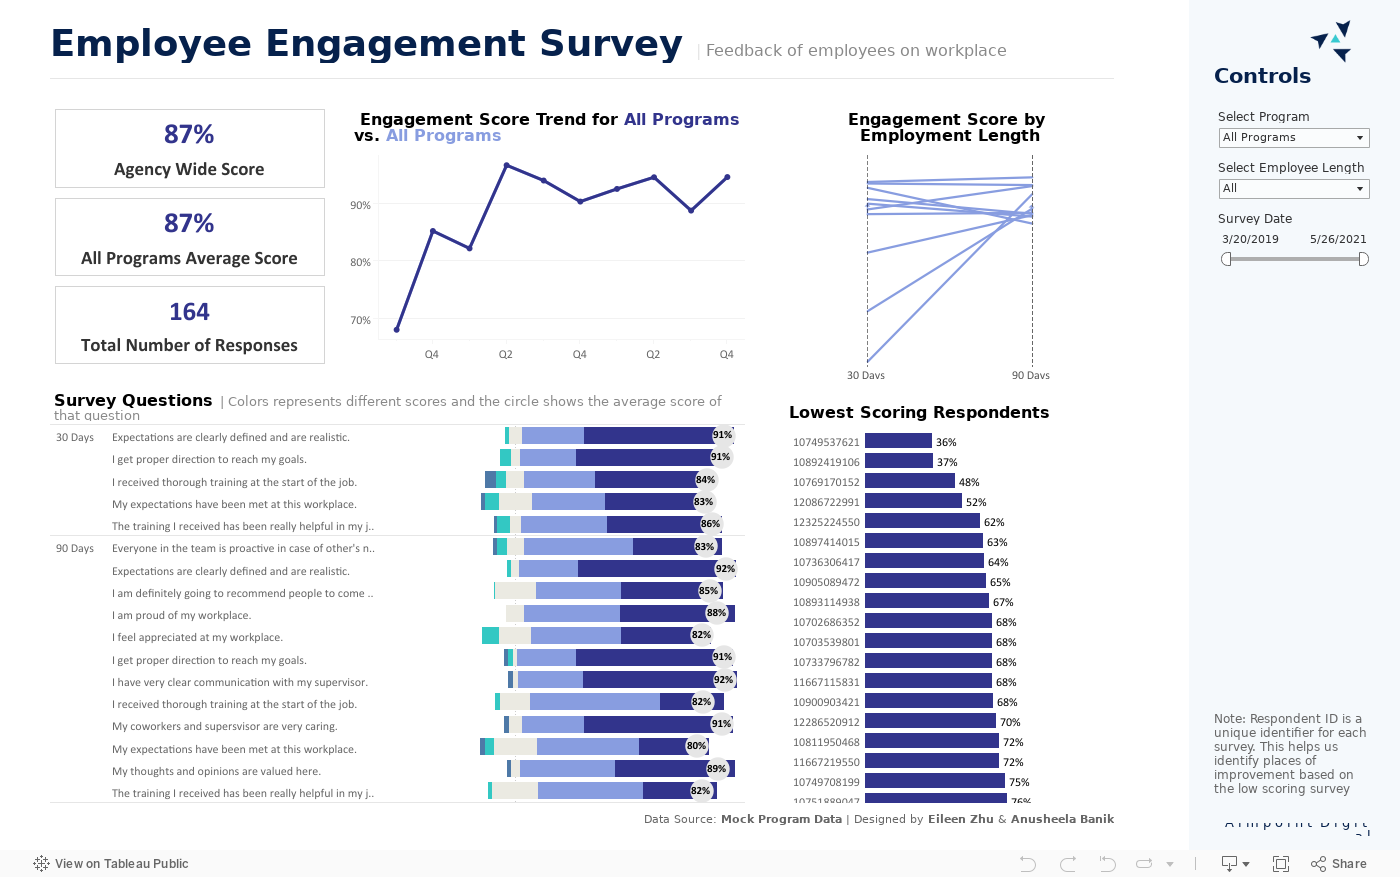
Employee Engagement Survey
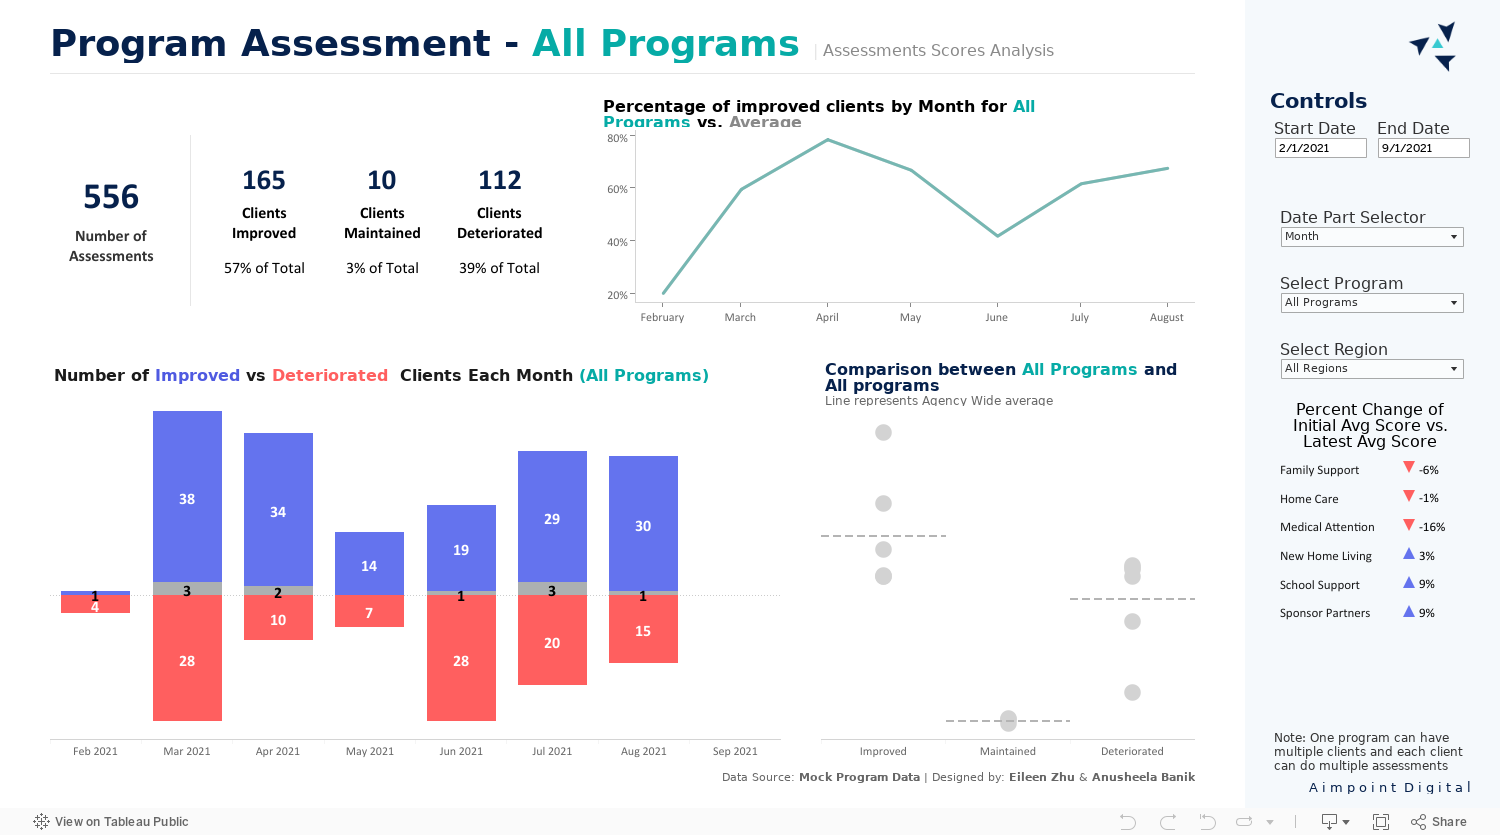
Program Assessment
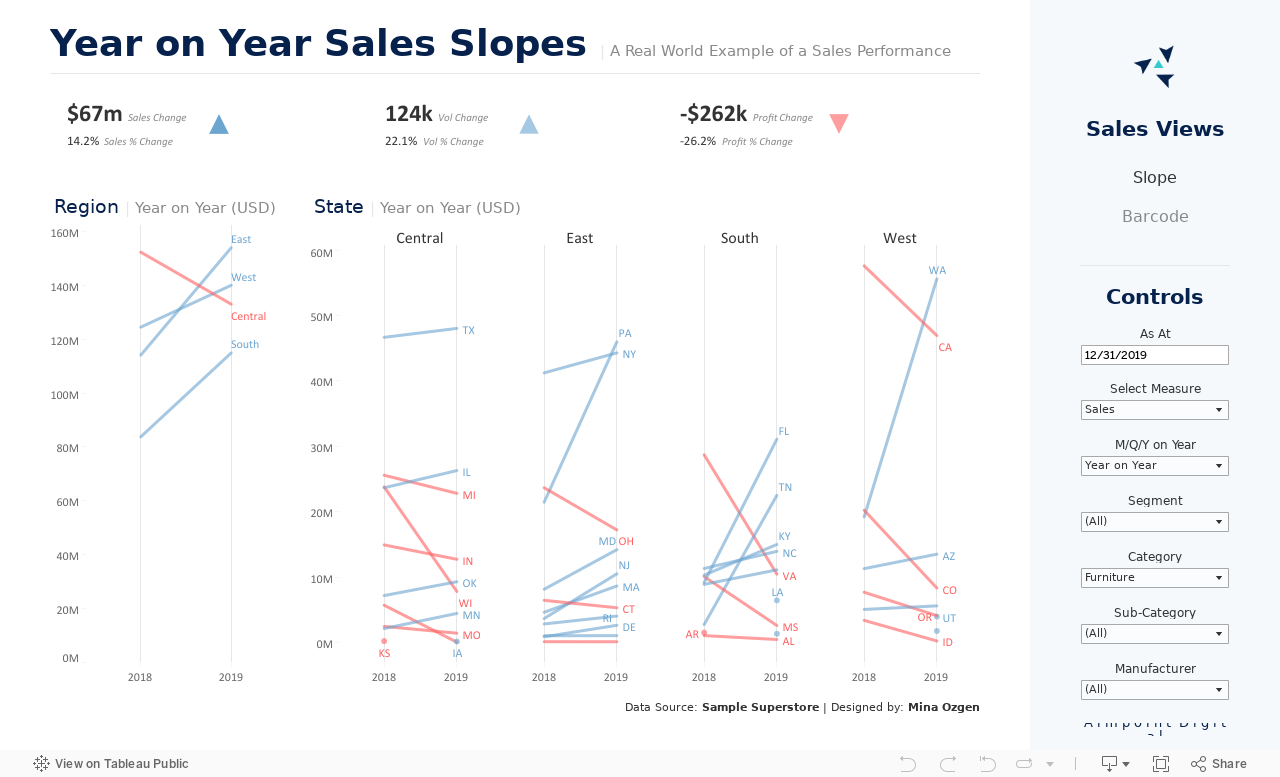
Sales on Year Performance Tracker
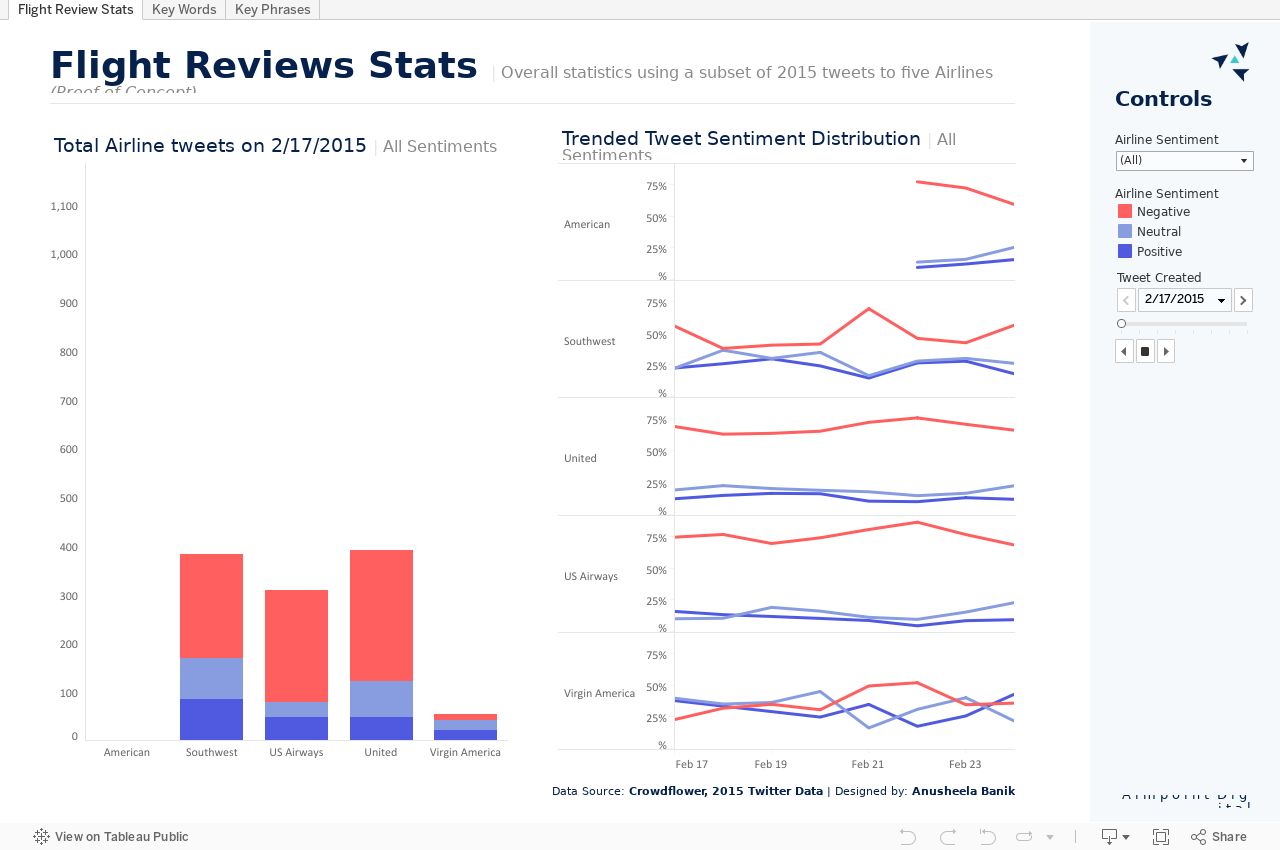
Text Analytics with Twitter Flight Reviews
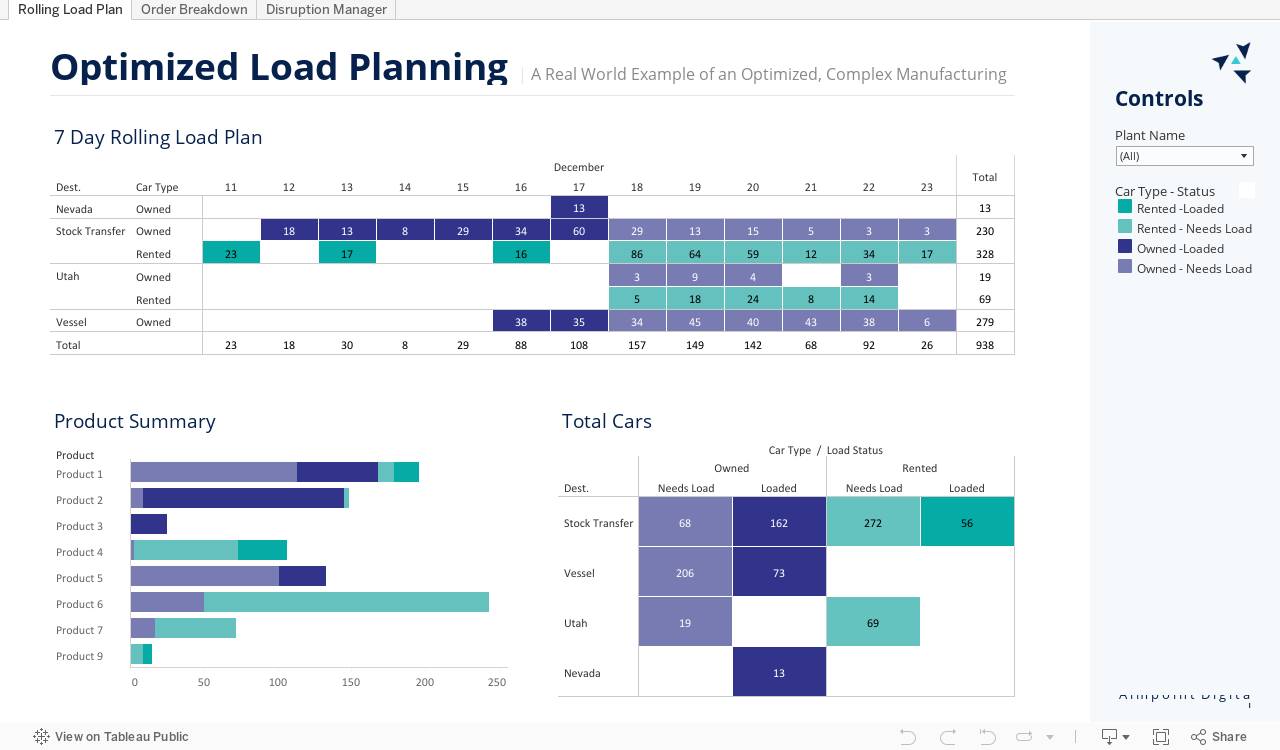
Manufacturing Optimized Load Planner
A sanitized set of dashboards from a manufacturing use case. Full project used data from five sources across many formats and tools to create an optimized load planning tool. Data from Dec 2019.
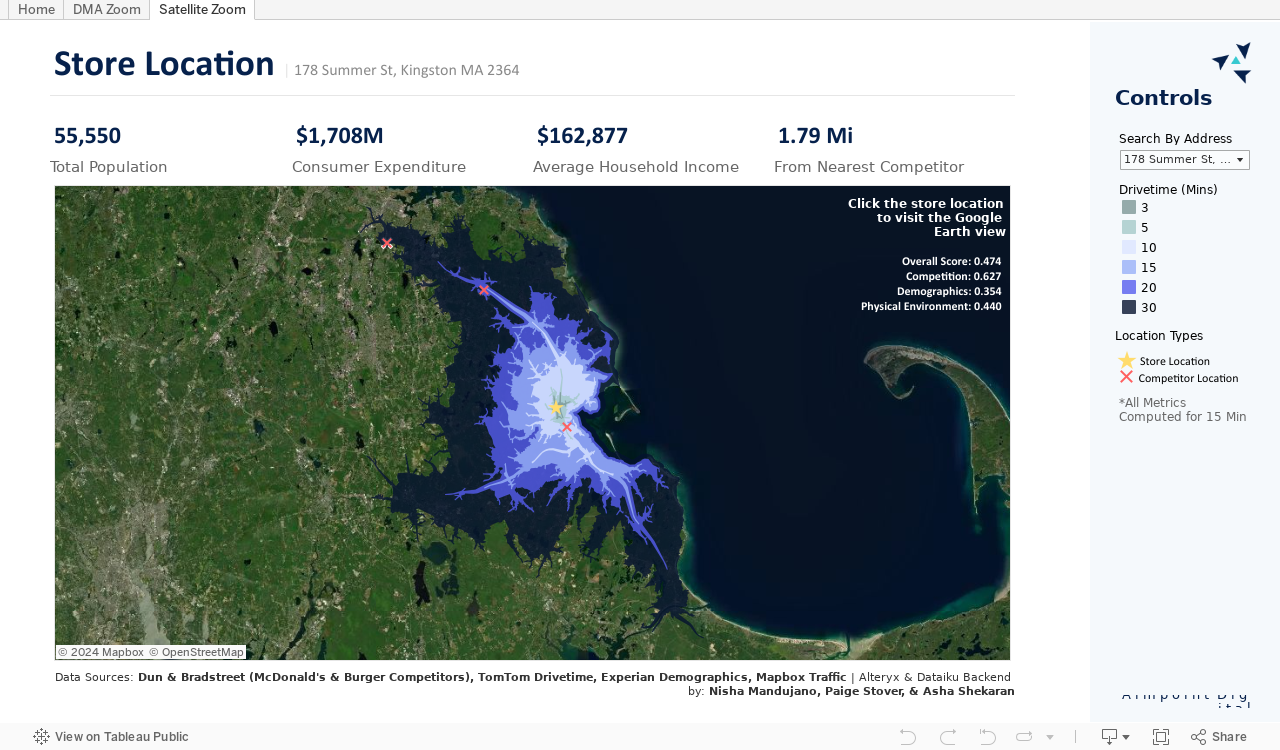
Site Planning & Hub Selection
Having a data-driven approach can maximize the probability of success and help companies understand their operating landscapes.
This dashboard was designed using Tableau and Alteryx, which recommend operational sites with the most economic potential for a company. It showcases a heat map of hot spots, the spread of store reach, and a detailed store view. These dashboards drill down from a US map to market areas that have been modeled in terms of competition, demographics, and the physical environment with parameterized weighting. The modeling was done using Dataiku.
It demonstrates how transportation, retail, and analytics can come together and how decision-making about site planning, hub building, and expansion can be taken to the next level.
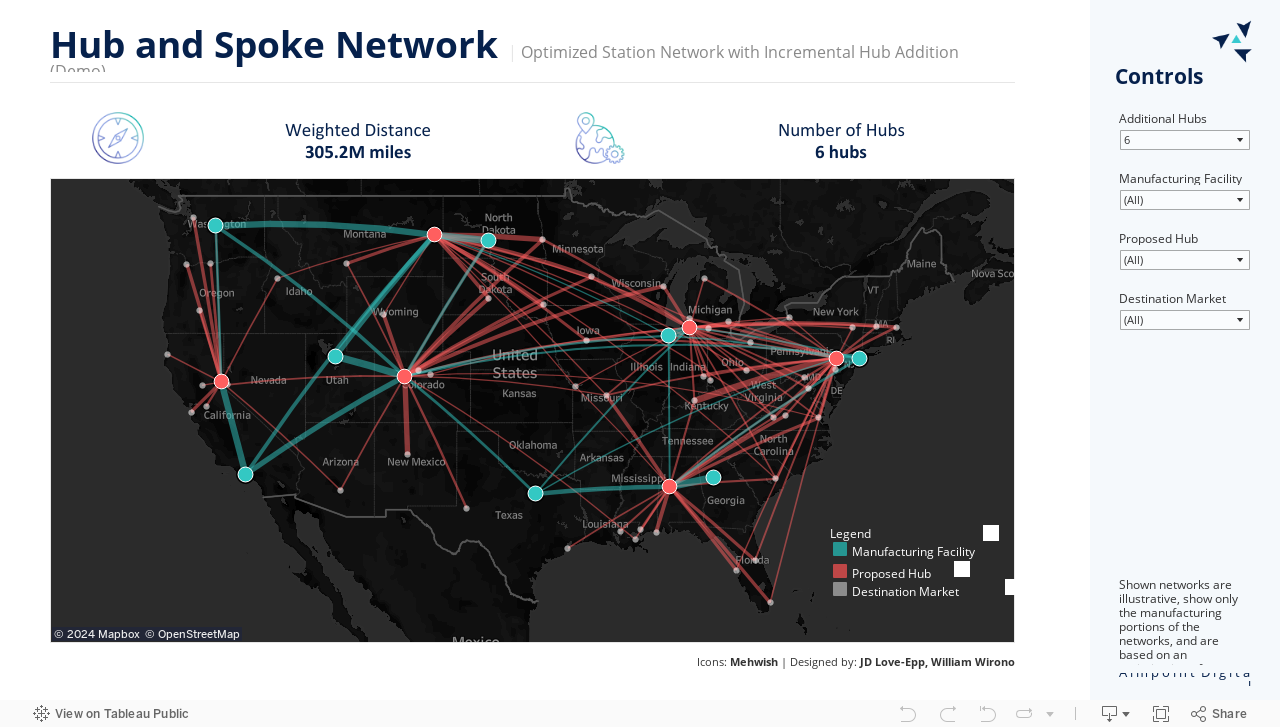
Supply Chain Network Optimization
At Aimpoint Digital, we emphasize ensuring our solutions continue to deliver value for our clients even after our engagement is over. Our solution was packaged in an easy-to-use and interactive form factor and integrated with the client’s existing tech stack. We provided extensive documentation and carried out multiple rounds of user testing. This will allow our clients to easily re-use the solution to re-optimize their network if market conditions change in the future.
The Tableau dashboard is based on anonymized data, which visualizes the optimal network for each additional hub. This led to an average decrease in the weighted distance by 10.6% per additional hub.
Read the blog behind the dashboard: https://aimpointdigital.com/blog/supply-chain-network-optimization/
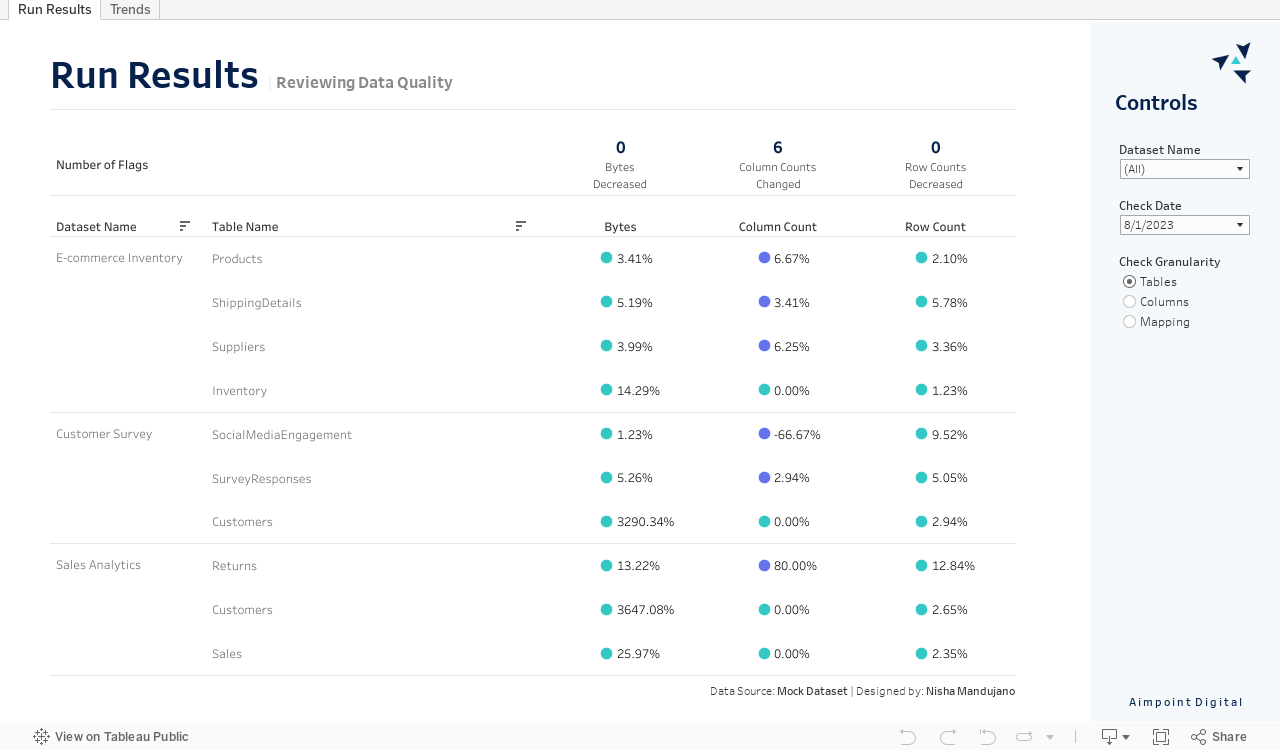
Data Quality Tracker
Let's talk AI & data. We'll architect what's next.
Whether you need advanced AI solutions, strategic data expertise, or tailored insights, our team is here to help.