
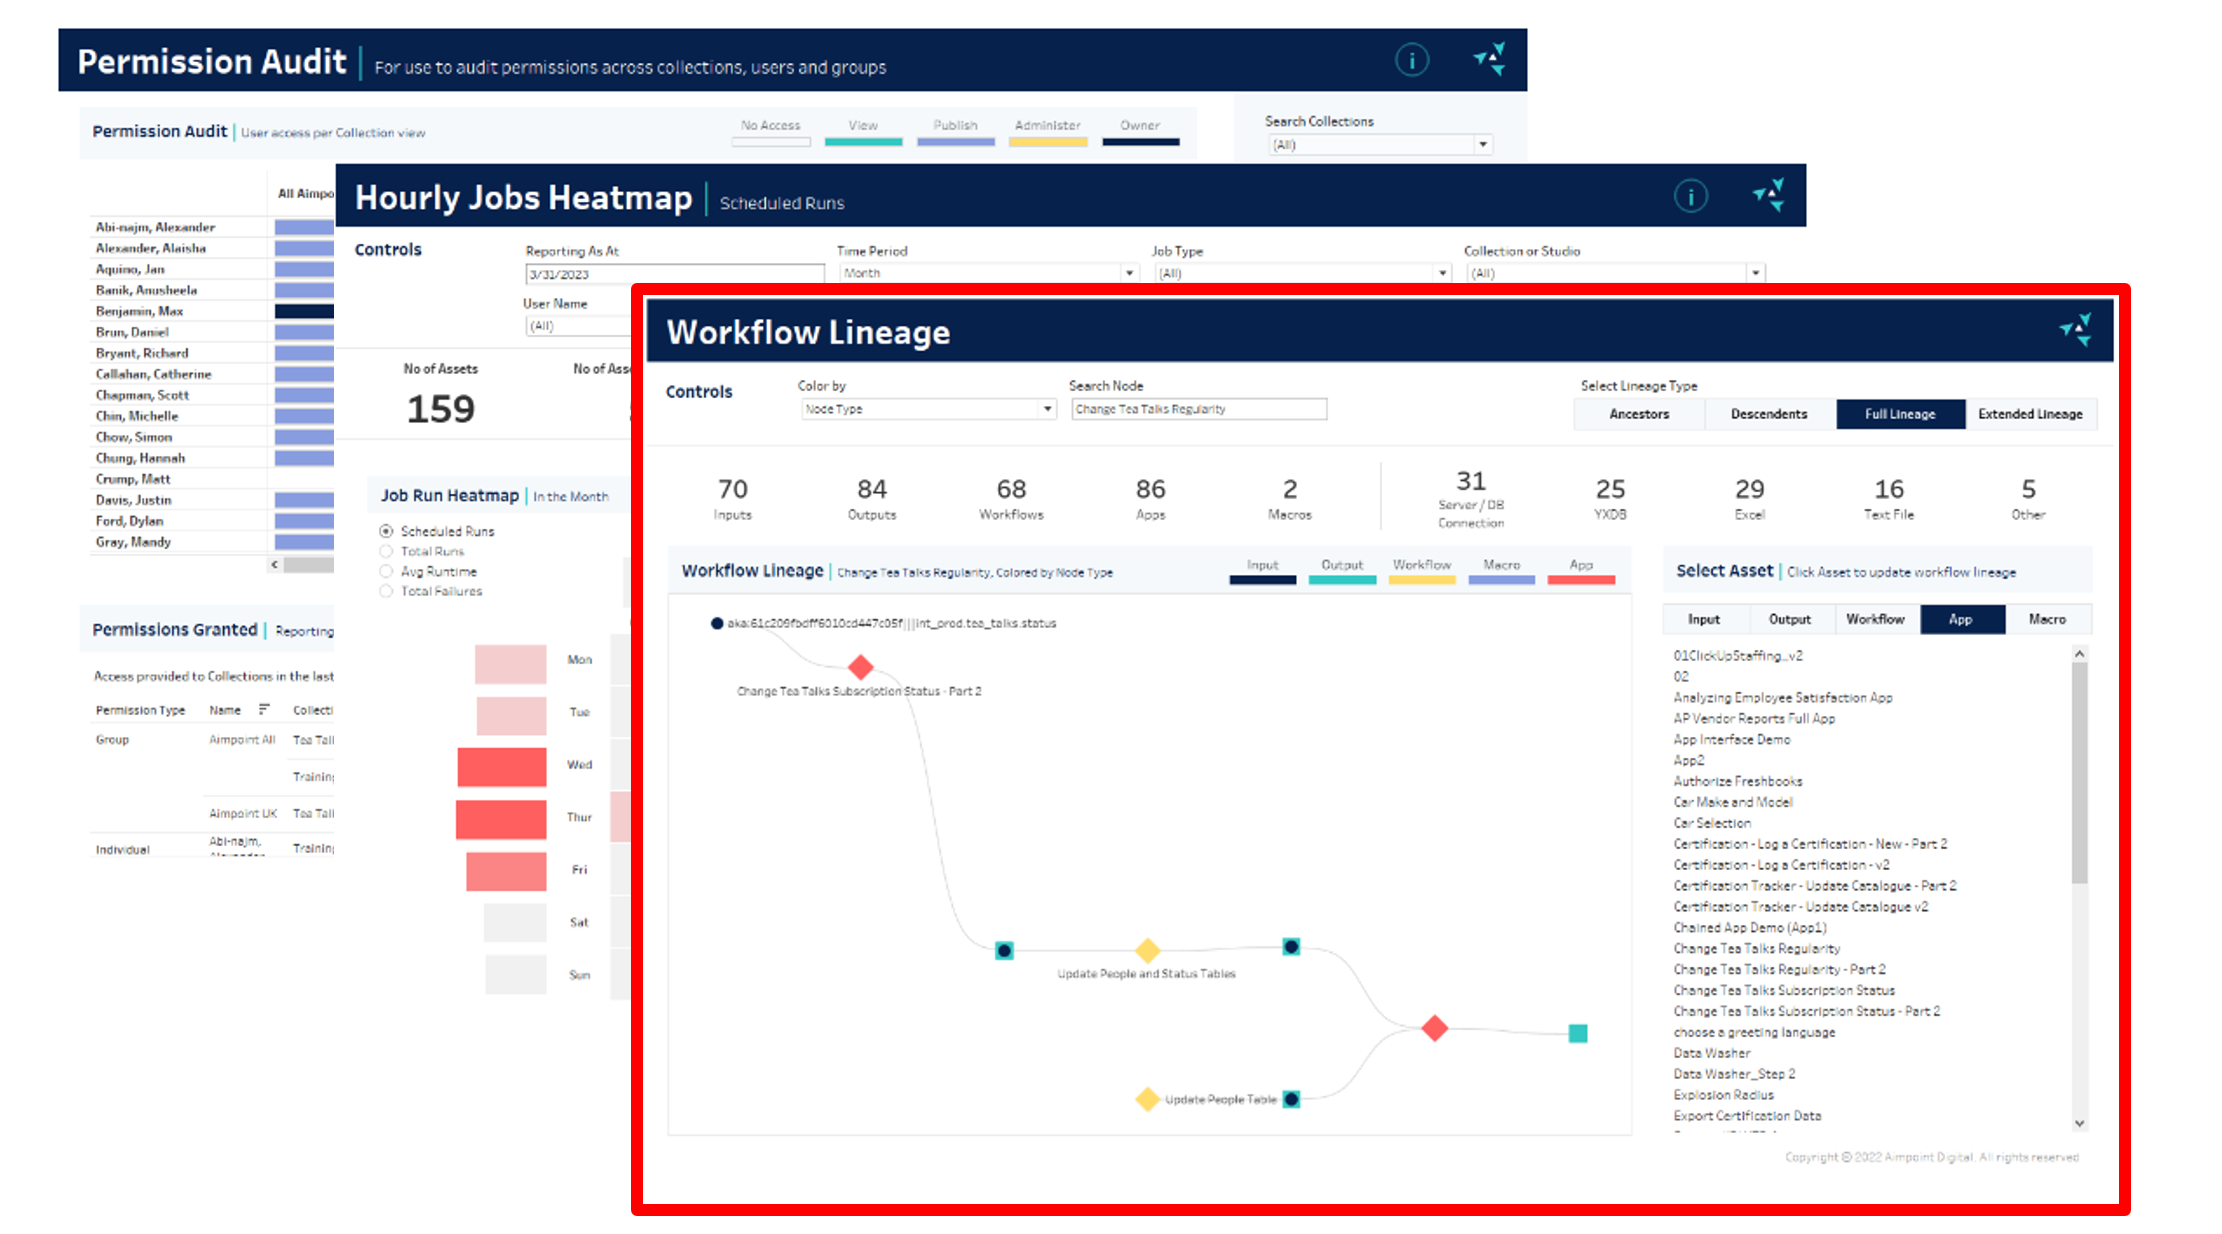
Alteryx Reporting to Visualize Workflow Lineage
ServerPAHL is our Alteryx Server Reporting Suite that provides important metrics for insights into Alteryx Server. As part of ServerPAHL, we have a dashboard dedicated solely to Workflow Lineage that shows how data sources and workflows are connected.
Why Alteryx Server Lineage?
The Workflow Lineage report aims to see the complexity of our entire set of workflows. Specifically, it shows the interconnectedness of workflows and data sources. If Workflow A outputs a file Customers.xlsx, which Workflow B then consumes, then the lineage flow chart would look like this,
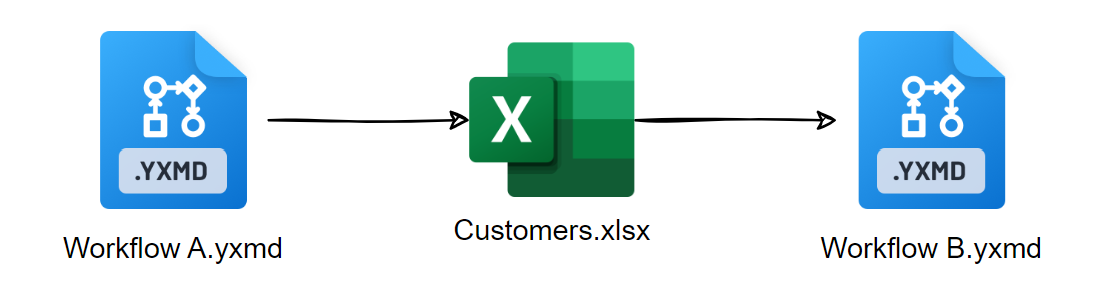
Why is this important? It means that if we have an error with Workflow A then we immediately know all descendants of that Workflow (In this case Workflow B) will be affected. By the same token, if we notice within Workflow B that the Customers.xlsx data is out of date, then we know to check Workflow A to locate the problem.
In addition to troubleshooting, Alteryx Server Lineage can help evaluate the risk of a process by visualizing the complexity and seeing how many upstream processes it depends on. It can also aid in workflow scheduling by ensuring workflows run before their descendants. And it can help with data governance by understanding the usage of data sources, as well as identifying who has and should have access. It is a valuable tool for understanding how an organization’s workflows and data sources fit together.
How Do We Do It?
Visualizing workflow lineage is an exciting proposition, but it’s also a challenging one.
In the simplest terms, we can plot the Lineage by downloading all the workflows from the server, extracting all the file or table names from the xml of the workflow, and plotting the result. In practice, it’s more complicated than this, but we can roughly outline the process in ten steps.
- Input the credentials to get the Bearer Token.
- Make a GET request to the /v3/workflows/{workflowId} endpoint to list all the workflow IDs on the server.
- Make a POST request to download all workflows on the server but not saved locally.
- Unzip the newly downloaded workflow packages.
- Delete the downloaded workflows that are no longer on the server.
- Read in the XML for each workflow (and nested macros).
- Parse the XML into JSON and then convert it to a Pandas DataFrame.
- For the tools of interest (namely Input Data, Output Data, and their In-Database equivalents), extract the filenames or SQL.
- Parse the SQL to find all the source tables.
- Determine the [From] and [To] fields for pairs of data sources and workflows.
- Find the coordinates that would plot the lineage as a DAG.
Download the Workflows
We need direct access to the xml of all the workflows on the server. And the best way to do that is to download them to a local folder. All subsequent workflow runs will compare the workflow on the server to the local directory. The workflows that exist on the server but not in the local directory should be downloaded. The workflows that are in the local directory but no longer on the server should be deleted. In this way, the current workflow state is replicated locally.

The downloaded workflows are packaged workflows (yxzp) files. These are just zip files, so we can change the extension to “.zip” and then unzip to extract the contents. Inside is the standard workflow or app and packaged assets such as data sources and macros.
Parse the Workflows
The next step is to extract information about the tools from the workflow. A workflow is just XML that provides the Alteryx Engine with a list of instructions. Therefore, by parsing the XML, we can find all the Input and Output tools and their configuration (including the relevant filenames and SQL statements).
You can see a simplified view of the XML structure below,

Within the workflow XML, each <Node> element represents a tool in the workflow. For each <Node>, there is a <GuiSettings> element that contains the name of the plugin (or tool) and an <Properties> element which contains information about the tool’s configuration such as, in the case of an Input Data Tool, the file or table it is connected to.
Once we have a record per tool per workflow, we can extract the files and table names necessary to determine the Lineage. The approach here differs depending on whether the tool connects to a file or makes a database connection. We can lift the text from the < file> element for a file connection. For SQL, it’s a bit more complicated, and we need to parse out the table names, as well as determine if those tables are upstream or downstream of the workflow.
Parsing Out SQL Tables
Tools with database connections may have embedded SQL queries (as well as Pre-SQL and Post-SQL statements). In these cases, we need to extract the referenced table names in the query and ascertain whether the table is being read (an ancestor of the workflow) or written to (a descendant of the workflow).
The tables can be extracted by looking for words following keywords in the SQL statement. For example, the names of the tables that follow FROM or JOIN are tables being read, and table names following CREATE TABLE are tables being written to. The different variants from standard ASCII SQL, CTEs, and the general complexity of some SQL statements make this a lot more complicated. For this reason, the logic of extracting tables from SQL is abstracted to a separate macro which standardizes the SQL and removes all the tables.
For example, passing the following SQL statements into the macro will output the following,
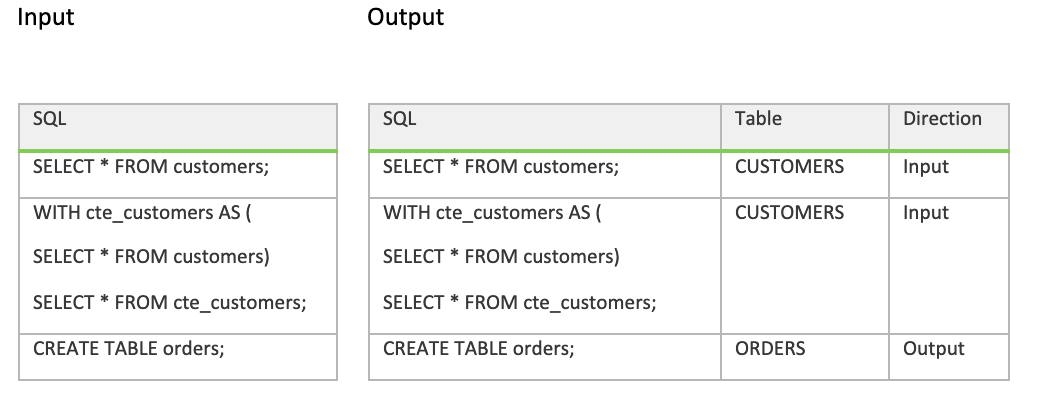
And using the Direction field, we can determine the descendants (Outputs) and ancestors (Inputs).
Plotting the Lineage
Once we have the [From] and [To] columns, where one is a workflow, and the other is a data source, we can plot the output. Creating a network chart showing how all these are connected is easy. Indeed, this is possible within Alteryx using the Network Analysis Tool to give an interactive network visualization.
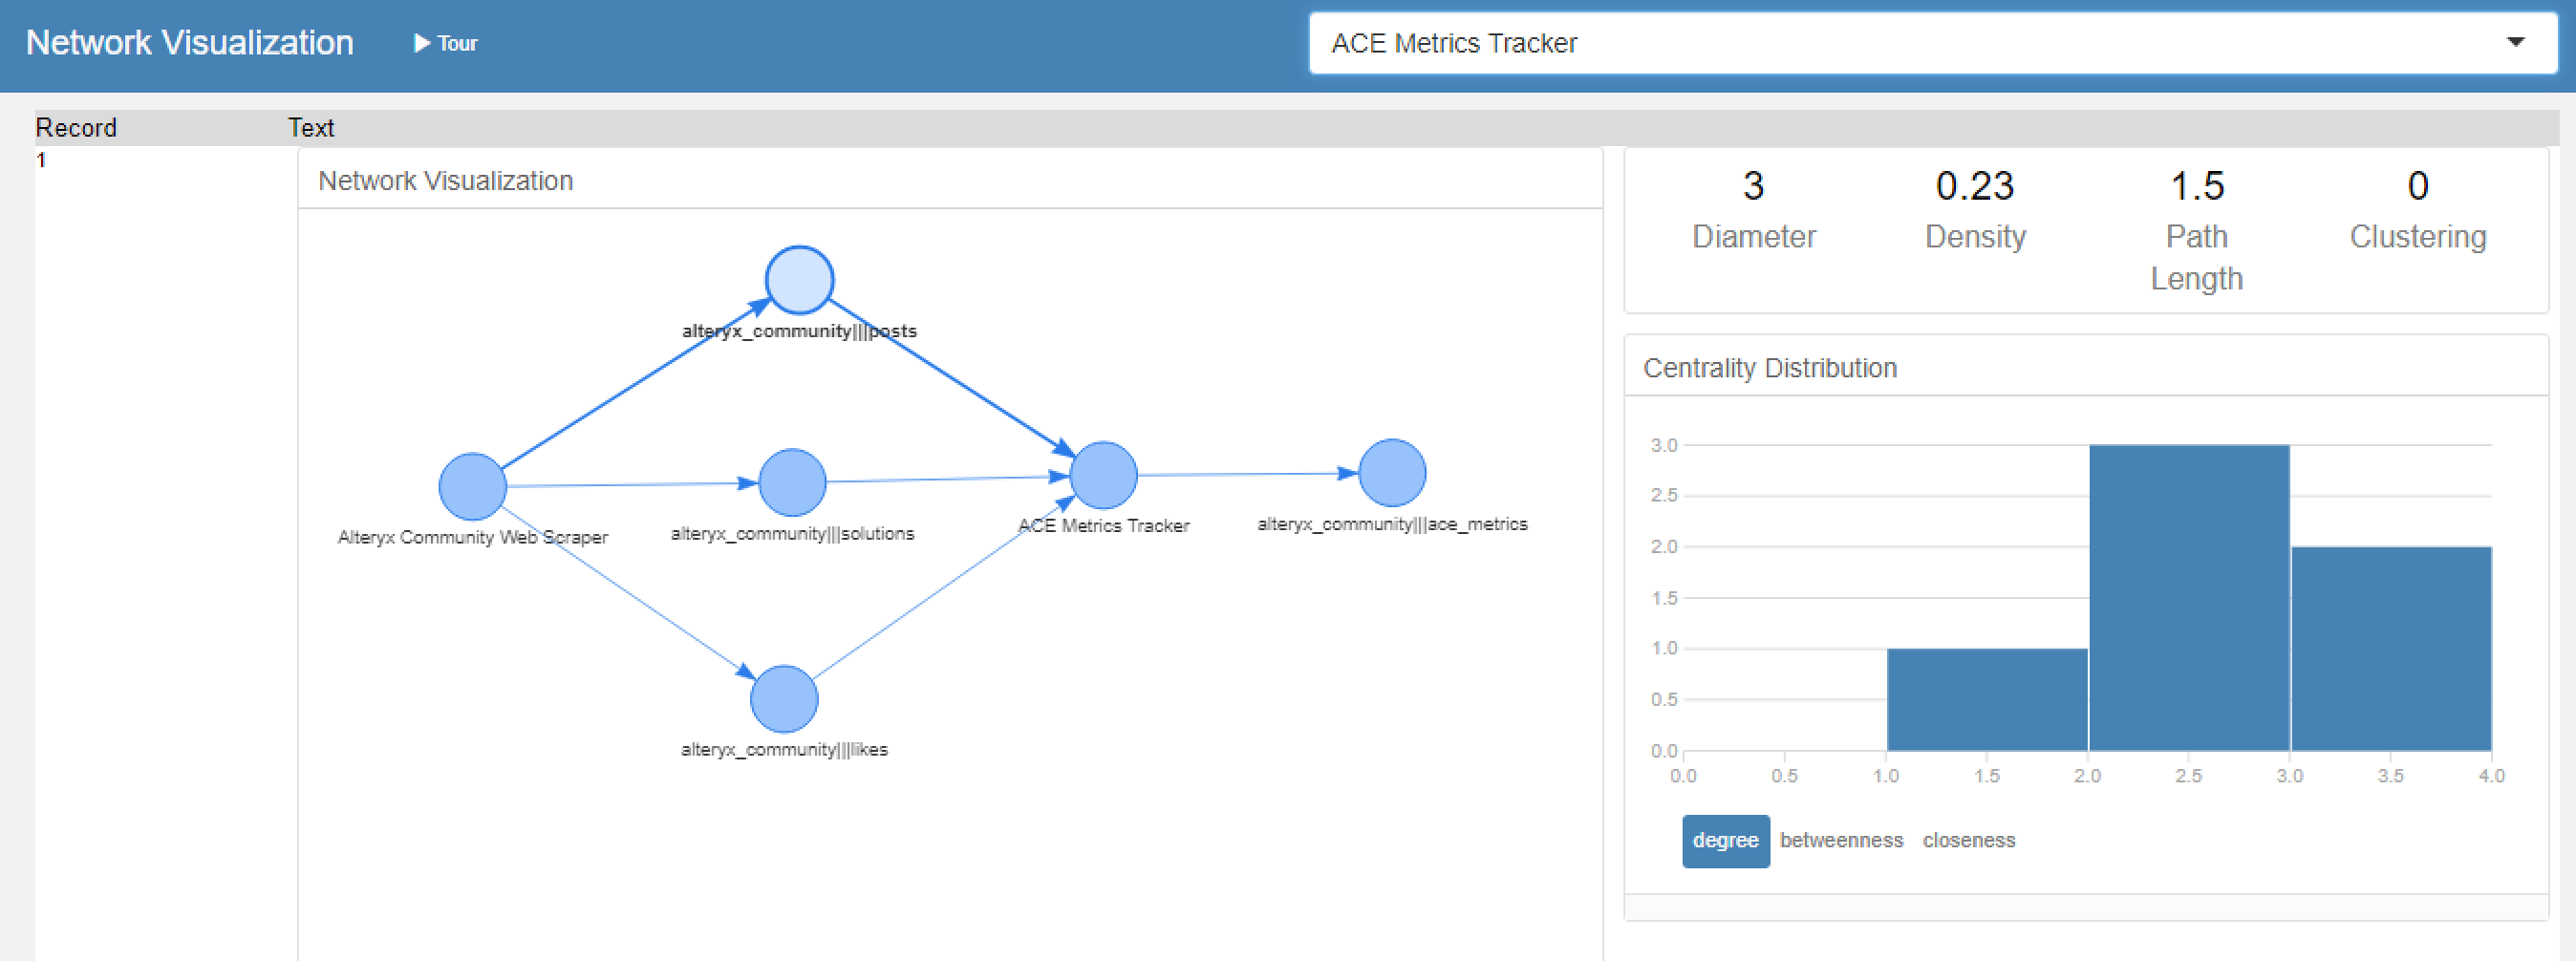
However, for a more detailed and consistent approach that we can plot in Tableau, we leverage a Python module that provides the coordinates to plot this as a DAG (Directed Acyclic Graph). Then, with some more data wrangling and scaffolding, we can get an attractive output with the appropriate filters, tooltips, and key metrics.
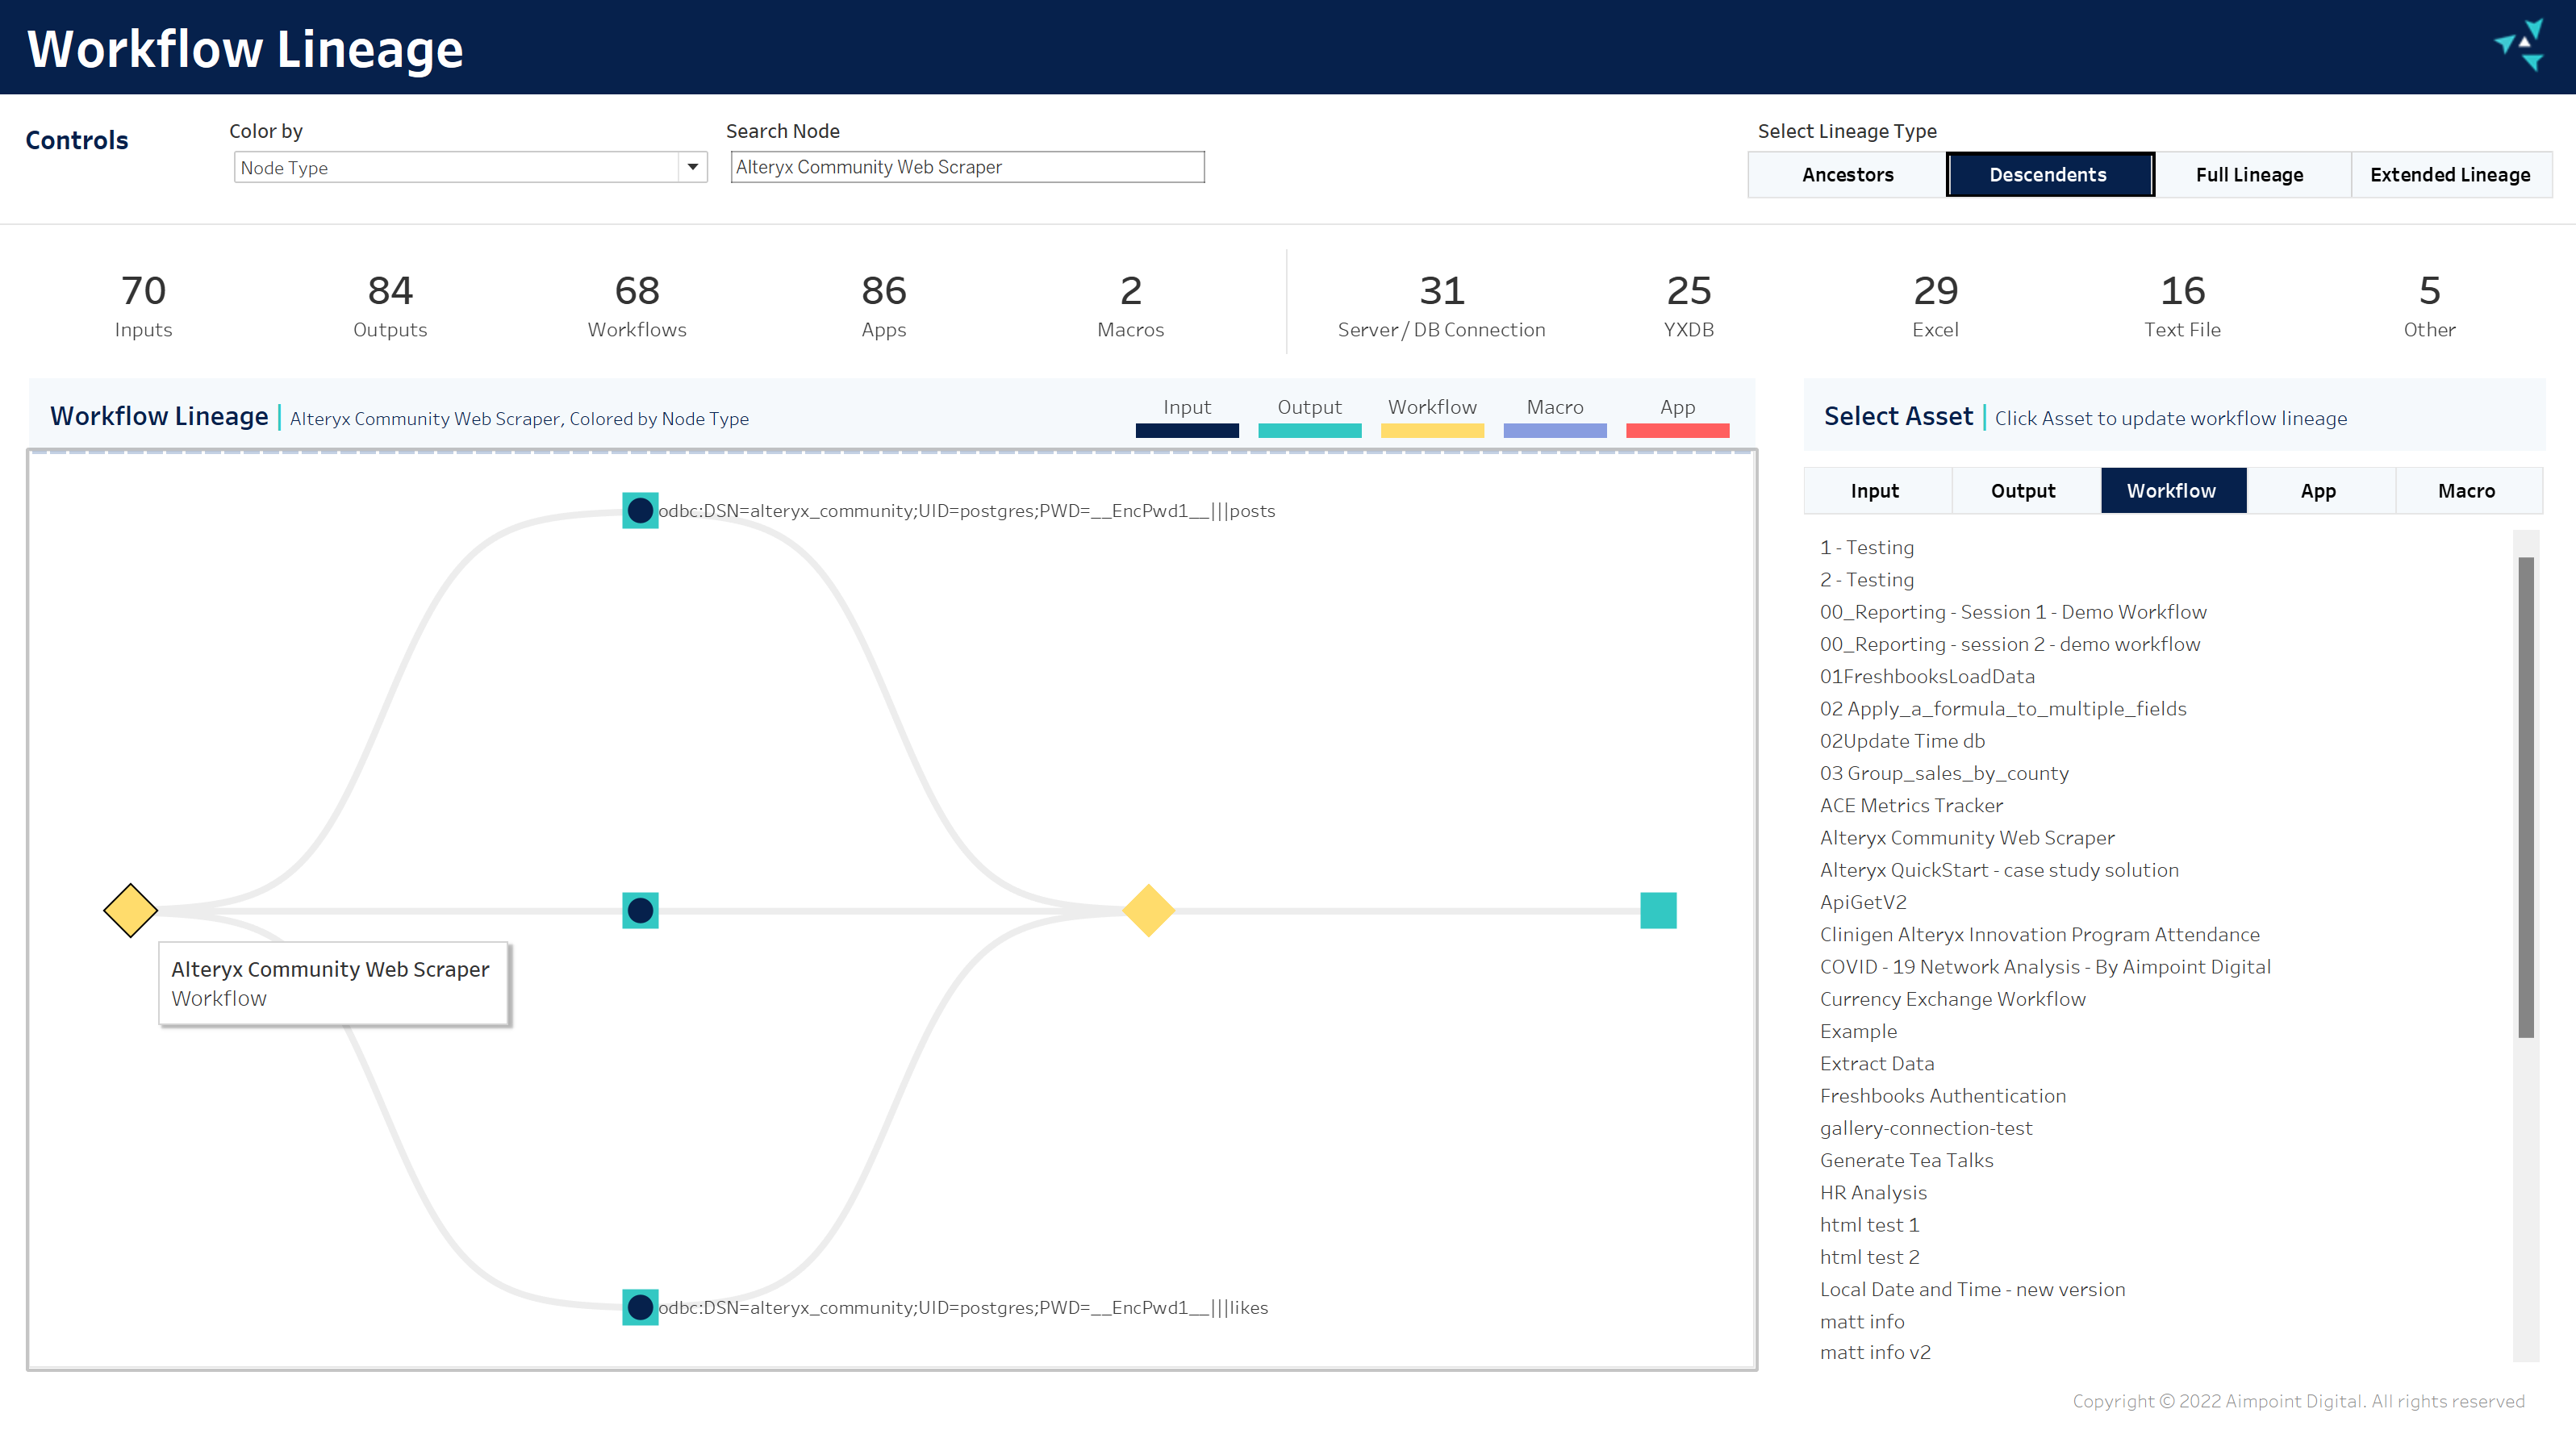
This approach gives us complete control over which asset to show (Input, Output, Workflow Type) and how much of the Lineage to show for that asset:
- Ancestors – upstream Lineage of the selected asset.
- Descendants – downstream lineage of the selected asset.
- Full Lineage – upstream and downstream lineage of the selected asset.
- Extended Lineage – upstream and downstream lineage of the selected asset and other assets using the same data sources.
The Workflow Lineage Report will provide some powerful insights to our customers, and I am excited to see how much value our customers will get from this.
Author


